The Hydrogen Atom
Shaun Williams, PhD
The Schrödinger Equation
- The hydrogen atom, containing an electron and a proton, is a two-particle system
- The internal motion of the two particles around their center of mass is equivalent to the motion of a single particle with a reduced mass
- The reduced particle is located at \(r\)
- The vector of the position of the electron relative to the proton
- Since the proton is much more massive than the electron, we will assume that the reduced mass equals the electron mass and the proton is at the center of mass.
Diagrams of the Hydrogen Atom
- The proton and electron of the hydrogen atom
- Equivalent reduced particle with reduced mass \(\mu\) at a distance \(r\) from the center of mass
Example 8.1
- Assuming the Bohr radius gives the distance between the proton and electron, calculate the distance of the proton from the center of mass, and calculate the distance of the electron from the center of mass.
- Calculate the reduced mass of the electron-proton system.
- In view of your calculations in (a) and (b), comment on the validity of a model in which the proton is located at the center of mass and the reduced mass equals the electron mass.
Similarity to a Previous System
- Since the internal motion of any two-particle system can be represented by the motion of a single particle with a reduced mass
- This means that the description of the hydrogen atom has much in common with the description of a diatomic molecule
- The Schrödinger equation for the hydrogen atom is $$ \begin{equation} \hat{\mathcal{H}}(r,\theta,\phi) \psi(r,\theta,\phi) = E\psi(r,\theta,\phi) \label{eq:8.1.1} \end{equation} $$
- The Schrödinger equation employs the same kinetic energy operator, \(\hat{T}\), written in spherical coordinates
- The Hamiltonina contains a potential energy term, \(\hat{V}\), to describe the attraction between the proton and electron $$ \begin{equation} \hat{V}(r)=-\frac{e^2}{4\pi \varepsilon_0 r} \label{eq:8.1.2} \end{equation} $$
The Hamiltonian and the Schrödinger Equation
- The full expression for \(\hat{\mathcal{H}}\) is spherical coordinates is $$ \begin{equation} \scriptsize{ \hat{\mathcal{H}}(r,\theta,\phi) = -\frac{\hbar^2}{2\mu r^2} \left[ \frac{\partial}{\partial r} \left( r^2 \frac{\partial}{\partial r} \right) + \frac{1}{\sin \theta} \frac{\partial}{\partial \theta} \left( \sin \theta \frac{\partial}{\partial \theta} \right) + \frac{1}{\sin^2 \theta} \frac{\partial^2}{\partial \phi^2} \right] - \frac{e^2}{4\pi \varepsilon_0 r} } \label{eq:8.1.3} \end{equation} $$
- The contributions from rotational and radial components of the motion become clearer if we write out the complete Schrödinger equation $$ \begin{equation} \tiny{ \left\{ -\frac{\hbar^2}{2\mu r^2} \left[ \frac{\partial}{\partial r} \left( r^2 \frac{\partial}{\partial r} \right) + \frac{1}{\sin \theta} \frac{\partial}{\partial \theta} \left( \sin \theta \frac{\partial}{\partial \theta} \right) + \frac{1}{\sin^2 \theta} \frac{\partial^2}{\partial \phi^2} \right] - \frac{e^2}{4\pi \varepsilon_0 r} \right\} \psi(r,\theta,\phi) = E\psi(r,\theta,\phi) } \label{eq:8.1.4} \end{equation} $$
Rearranging the Schrödinger Equation
- Doing some algebra on the Schrödinger equation $$ \begin{equation} \begin{split} \hbar^2 & \frac{\partial}{\partial r} \left( r^2 \frac{\partial}{\partial r} \psi(r,\theta,\phi) \right) + 2\mu r^2 \left[ E + \frac{e^2}{4\pi \varepsilon_0 r} \right] \psi(r,\theta,\phi) = \\ & -\hbar^2 \left[ \frac{1}{\sin \theta} \frac{\partial}{\partial \theta} \left( \sin \theta \frac{\partial}{\partial \theta} \right) + \frac{1}{\sin^2 \theta} \frac{\partial^2}{\partial \phi^2} \right] \psi(r,\theta,\phi) \end{split} \label{eq:8.1.6} \end{equation} $$
- This manipulation has helped us identify the angular momentum operator in Equation \eqref{eq:8.1.6}
- This is the same square of the angular momentum operator that we saw in the last chapter $$ \begin{equation} \hat{M}^2=-\hbar^2 \left[ \frac{1}{\sin\theta} \frac{\partial}{\partial \theta} \left( \sin \theta \frac{\partial}{\partial \theta} \right) + \frac{1}{\sin^2} \frac{\partial}{\partial \phi^2} \right] \label{eq:8.1.7} \end{equation} $$
More Rearrangement to the Schrödinger Equation
- Substituting Equation \eqref{eq:8.1.7} into Equation \eqref{eq:8.1.6} $$ \begin{equation} \hbar^2 \frac{\partial}{\partial r} \left( r^2 \frac{\partial}{\partial r} \psi(r,\theta,\phi) \right) + 2\mu r^2 \left[ E-\hat{V} \right] \psi(r,\theta,\phi) = \hat{M}^2 \psi(r,\theta,\phi) \label{eq:8.1.8} \end{equation} $$
Example 8.2
Show the algebraic steps going from Equation \eqref{eq:8.1.4} to Equation \eqref{eq:8.1.6} and finally to Equation \eqref{eq:8.1.8}. Justify the statement that the rotational and radial motion are separated in Equation \eqref{eq:8.1.8}.
Analysis of the Schrödinger Equation
- Since the angular momentum operator does not involve the radial variable, \(r\), we can separate variables in Equation \eqref{eq:8.1.8} by using a product wavefunction
- We already know that the eigenfunctions of the angular momentum operator are the spherical harmonic functions, \(Y(\theta,\phi)\) $$ \begin{equation} \psi(r,\theta,\phi) = R(r)Y(\theta,\phi) \label{eq:8.1.9} \end{equation} $$
- The spherical harmonics provide information about where the electron is around the proton
- The radial function, \(R(r)\), describes how far the electron is away from the proton
Separating the Schrödinger Equation
- To separate the variables, we substitute Equation \eqref{eq:8.1.9} into Equation \eqref{eq:8.1.8} and then divide each side by \(R(r)Y(\theta,\phi)\)
- We then set the each side of that resulting equation equal to a constant \(\lambda\) $$ \begin{equation} \frac{\hbar^2}{R(r)} \frac{\partial}{\partial r}r^2 \frac{\partial}{\partial r}R(r) + \frac{2\mu r^2}{R(r)} \left[ E-V \right]R(r) = \lambda \label{eq:8.1.10} \end{equation} $$ $$ \begin{equation} \frac{1}{Y(\theta,\phi)} \hat{M}^2 Y(\theta,\phi) = \lambda \label{eq:8.1.11} \end{equation} $$
- These are the radial differential equation and the angular differential equation
- We solve the separately to give \(Y(\theta,\phi)\) and \(R(r)\).
Example 8.3
Complete the steps leading from Equation \eqref{eq:8.1.8} to Equation \eqref{eq:8.1.10} and Equation \eqref{eq:8.1.11}.
The Angular Piece
- Rearranging Equation \eqref{eq:8.1.11} gives $$ \begin{equation} \hat{M}^2 Y_l^{m_l}(\theta,\phi)=\lambda Y_l^{m_l}(\theta,\phi) \label{eq:8.1.12} \end{equation} $$
- We have added the indices \(l\) and \(m_l\) because they are customary for electronic states
- When we previously saw indices \(J\) and \(m_J\) which are used for rotational states
- Further, the electronic angular momentum is designated by \(L\) and the corresponding operator is called \(\hat{L}\)
- In complete electron notation, the eigenvalue equation is $$ \begin{equation} \hat{L}^2 Y_l^{m_l}(\theta,\phi)=\lambda Y_l^{m_l}(\theta,\phi) \label{eq:8.1.13} \end{equation} $$
Analysis of the Angular Piece
- We now know that \(Y_l^{m_l}(\theta,\phi)\) must be an eigenfunction of the angular momentum operator \(\hat{L}^2\) with eigenvalue \(\lambda\)
- We know from our analysis of the rigid rotor that the eigenvalue \(\lambda\) is \(J(J+1)\hbar^2\), or in electronic notation \(l(l+1)\hbar^2\)
- So, Equation \eqref{eq:8.1.13} becomes $$ \begin{equation} \hat{L}^2 Y_l^{m_l}(\theta,\phi) = l(l+1)\hbar^2 Y_l^{m_l}(\theta,\phi) \label{eq:8.1.14} \end{equation} $$
- We can plug this into our radial equation (Equation \eqref{eq:8.1.10}) and rearrange to get $$ \begin{equation} -\frac{\hbar^2}{2\mu r^2}\frac{\partial}{\partial r} r^2 \frac{\partial}{\partial r} R(r) + \left[ \frac{l(l+1)\hbar^2}{2\mu r^2} + V(r) - E \right] R(r) = 0 \label{eq:8.1.15} \end{equation} $$
Example 8.4
Write the steps leading from Equation \eqref{eq:8.1.10} to Equation \eqref{eq:8.1.15}.
Solution to the Radial Equation
- The details for how to solve the radial equation are very complicated and will not be covered here
- The eigenfunction contains polynomials that are related to the associated Laguerre polynomials, \(L_{n,l}(r)\) $$ \begin{equation} L_{n,l}(r)=\sum_{r=0}^{n-l-1} c_i r^i \label{eq:8.1.17} \end{equation} $$ where \(c_i\) are constant coefficients
- Physically acceptable solutions require that \(n\) must be greater than or equal to \(l+1\)
- The smallest value of \(l\) is zero so the smallest value of \(n\) is 1
The Radial Wavefunction
- The full \(R(r)\) function is $$ \begin{equation} R(r)=N_{n,l} \left(\frac{r}{a_0}\right)^l L_{n,l}(r)e^{-\frac{r}{na_0}} \label{eq:8.1.18} \end{equation} $$
- In the following equations
- \(Z\) is the atomic number
- \(\rho=\frac{Zr}{a_0}\)
- \(a_0\) is the Bohr radius
Radial Functions for One-Electron Atoms and Ions
| \(n\) | \( \) | \(l\) | \( \) | \(R_{n,l}(\rho)\) |
|---|---|---|---|---|
| \( 1 \) | \( 0 \) | \( 2\left( \frac{Z}{a_0} \right)^\frac{3}{2}e^{-\rho} \) | ||
| \( 2 \) | \( 0 \) | \( \frac{1}{2\sqrt{2}}\left(\frac{Z}{a_0}\right)^\frac{3}{2} (2-\rho)e^{-\frac{\rho}{2}} \) | ||
| \( 2 \) | \( 1 \) | \( \frac{1}{2\sqrt{6}}\left(\frac{Z}{a_0}\right)^\frac{3}{2} \rho e^{-\frac{\rho}{2}} \) | ||
| \( 3 \) | \( 0 \) | \( \frac{1}{81\sqrt{3}}\left(\frac{Z}{a_0}\right)^\frac{3}{2} (27-18\rho +2\rho^2) e^{-\frac{\rho}{3}} \) | ||
| \( 3 \) | \( 1 \) | \( \frac{1}{81\sqrt{6}}\left(\frac{Z}{a_0}\right)^\frac{3}{2} (6\rho-\rho^2) e^{-\frac{\rho}{3}} \) | ||
| \( 3 \) | \( 2 \) | \( \frac{1}{81\sqrt{30}}\left(\frac{Z}{a_0}\right)^\frac{3}{2} \rho^2 e^{-\frac{\rho}{3}} \) |
The Hydrogen Atom
- The constraint that \(n\) be greater than or equal to \(l+1\) also quantizes the energy
- This produces the hydrogen atom energy levels that was obtained from the Bohr model $$ \begin{equation} E_n = -\frac{\mu e^4}{8\varepsilon_0^2 h^2 n^2} \label{eq:8.1.19} \end{equation} $$
- The Schrödinger model does not produce well-defined orbits for the electron
- The quantization of angular momentum is different from what Bohr proposed
- Bohr: quantized in integer units of \(\hbar\)
- Schrödinger model: \(\sqrt{l(l+1)}\hbar\)
- The quantum number natural fall out of the derivation
The Wavefunctions
- The wavefunctions for the hydrogen atoms are products of a spherical harmonic function and a radial function $$ \begin{equation} \psi_{n,l,m_l}(r,\theta,\phi) = R_{n,l}(r) \cdot Y_l^{m_l}(\theta,\phi) \label{eq:8.2.1} \end{equation} $$
- The absolution square of the wavefunction, \( \left|\psi(r,\theta,\phi)\right|^2\), evaluated at \(r\), \(\theta\), and \(\phi\) gives the probability density of finding the electron inside a differential volume \(d\tau\) centered at that position
- The hydrogen atom wavefunctions, \(\psi(r,\theta,\phi)\), are called atomic orbitals
- An atomic orbital describes one electron in an atom
- The wavefunction with \(n=1\), \(l=0\), and \(m_l=0\) is called the 1s orbital
- Having multiple \(m_l\) values yield multiple orbitals in the 2p, 3d, etc.
The Quantum Numbers
- The principal quantum number - \(n\)
- \( n=1,2,3,\dots \)
- The angular momentum quantum number - \(l\)
- You might see this referred to as the azimuthal quantum number
- \( l=0,1,\dots,n-1 \)
- \(l\) values are typically coded as letters: \(l=0\rightarrow s\), \(l=1\rightarrow p\), \(l=2\rightarrow d\), and \(l=3\rightarrow f\)
- The magnetic quantum number - \(m_l\)
- This is because the energy in a magnetic field is partially dependent on \(m_l\)
- \( m_l = -l,\dots,0,\dots,l \)
Example 8.5
Consider several values for \(n\) and show that the number of orbitals for each \(n\) is \(n^2\).
Example 8.6
Construct a table summarizing the allowed values for the quantum numbers \(n\), \(l\), and \(m_l\), for \(n=1-7\).
Example 8.7
The notation 3d specifies the quantum numbers for an electron in the hydrogen atom. What are the values for \(n\) and \(l\) ? What are the values for the energy and angular momentum? What are the possible values for the magnetic quantum number? What are the possible orientations for the angular momentum vector?
Visualizing the Orbitals
- Visualizing the variation of a wavefunction is important because the absolute square of the wavefunction depicts the electrons distribution in an atom or molecule
- This charge distribution is central to chemistry because it is related to chemical reactivity
- This visualization is challenging because it requires examining the behavior of three variables in three-dimensional space
- This becomes easier by looking at the radial and the angular parts separately
- The shape can be fully revealed in a probability density plot
- In these plots we shade or color a region proportional to the magnitude of \(\psi^*\psi\)
Contour Plot of Electron Density
- Contour plots in the x-y plane for the \(2p_x\) and \(3p_x\) orbitals of the hydrogen atom.
- The plots map lines of constant values of \(R(r)^2\); red lines follow paths of high \(R(r)^2\), blue for low \(R(r)^2\).
- The angular function used to create the figure was a linear combination of two Spherical Harmonic functions
Radial Functions
- Here we see graphs of the radial functions, \(R(r)\), for the 1s, 2s, and 2p orbitals
- Notice: 2s curve crosses \(y=0\)
- When the wavefunction equals zero, it is called a radial node
- There is no electron density at these points
- There are \(n-l-1\) radial nodes in a wavefunction
- Notice the high density value in the 1s at the nucleus
- As we shall see later, the probability of finding an electron at the nucleus is vanishingly small.
Example 8.8
Examine the mathematical forms of the radial wavefunctions. What feature in the functions causes some of them to go to zero at the origin while the s functions do not go to zero at the origin?
Example 8.9
What mathematical feature of each of the radial functions controls the number of radial nodes?
Example 8.10
At what value of \(r\) does the 2s radial node occur?
Radial Probability Density
- The quantity \(R(r)^*R(r)\) is the radial probability density
- This is the probability density for the electron to be at a point a distance \(r\) from the proton
Radial Distribution Function
- Multiplying the radial probability density by the area of the spherical surface represented by that value of \(r\) yields the radial distribution function
- Mathematically, this is \( 4\pi r^2 R(r)^* R(r) \) or \(4\pi r^2 \left| R(r) \right|^2 \)
The 2s Orbital
Orbital Energy Levels, Selection Rules, and Spectroscopy
- The orbital energy eigenvalues are given by
$$ \begin{equation} E_n = -\frac{\mu e^4}{8\varepsilon_0^2 h^2 n^2} \label{eq:8.3.1} \end{equation} $$
- \(\mu\) is the reduced mass of the proton and electron
- \(n\) is the principle quantum number
- \(e\), \(\varepsilon_0\), and \(h\) are the fundamental constants
- The energy is negative and approaches zero as \(n\rightarrow \infty\)
Energy Levels
- Since hydrogen is used as the foundation for multi-electron system, it is useful to remember the total energy (binding energy) of the ground state hydrogen atom, \(E_H=-13.6\,eV\)
- The spacing between electronic energy levels for small values of \(n\) is very large then gets smaller rapidly at higher \(n\) values
- The line spectra produced by hydrogen atoms are a consequence of the quantum mechanical energy level expression (Equation \eqref{eq:8.3.1})
Example 8.11
Using Equation \eqref{eq:8.3.1} and a spreadsheet program or other software of your choice, calculate the energies for the lowest 100 energy levels of the hydrogen atom. Also calculate the differences in energy between successive levels. Do the results from these calculations confirm that the energy levels rapidly get closer together as the principal quantum number \(n\) increases? What happens to the energy level spacing as the principle quantum number approaches infinity?
Degeneracy
- We have already seen that for energy levels with \(n\gt 1\) can have several orbitals with the same energy
- As the energy and \(n\) increase, the degeneracy of the orbital energy level also increase
- As we have seen, the number of orbitals with a particular energy and value of \(n\) is given by \(n^2\) - each orbital energy level is predicted to be \(n^2\)-degenerate
- This high degree of orbital degeneracy is predicted only for one-electron systems
- When multiple electron are in the atom, electron-electron repulsion removes the \(l\) degeneracy
The Transition Moment
- We need to determine which transitions are allowed and which are forbidden
- Therefore we need to find selection rules from the transition moment integral $$ \begin{equation} \expect{\mu_T} = \int \psi_{n_f,l_f,{m_l}_f}(r,\theta,\phi) \hat{\mu} \psi_{n_i,l_i,{m_l}_i}(r,\theta,\phi) d\tau \label{eq:8.3.2} \end{equation} $$ or in bra-ket notation $$ \begin{equation} \Braket{ \psi^*_{n_f,l_f,{m_l}_f} | \hat{\mu} | \psi^*_{n_i,l_i,{m_l}_i} } \label{eq:8.3.3} \end{equation} $$ where the dipole moment operator is $$ \begin{equation} \hat{\mu} = -e\hat{r} = -er\left(\bar{x}\sin \theta \cos \phi+\bar{y}\sin \theta \sin \phi + \bar{z} \cos \theta \right) \label{eq:8.3.5} \end{equation} $$
Evaluating the Integral
- We now know that our \(\expect{\mu_T}\) integral is actually a triple integral over the three variables
- Evaluation reveals that the \(r\) integral always differs from zero so $$ \begin{equation} \Delta n = n_f-n_i = \text{not restricted} \label{eq:8.3.6} \end{equation} $$
- So, there is no restriction on the change in the principle quantum number: \(\Delta n \gt 0\) for absorption, \(\Delta n \lt 0\) for emission, and \(\Delta n=0\) when the orbital degeneracy is removed by an external field or other interaction
- There are also rules for \(l\) and \(m_l\) $$ \begin{equation} \Delta l =\pm 1 \text{ and } \Delta m_l = 0,\pm 1 \label{eq:8.3.7} \end{equation} $$
Magnetic Properties and the Zeeman Effect
- Magnetism results from the circular motion of charged particles
- Electrons in atoms are moving charges with angular momentum so they too produce a magnetic dipole
- This is why some materials are magnetic
- A magnetic dipole interacts with an applied magnetic field
- The energy of this interaction is given by the scalar product of the magnetic dipole moment and the magnetic field, \(\vec{B}\) $$ \begin{equation} E_B=-\vec{\mu} \cdot \vec{B} \label{eq:8.4.1} \end{equation} $$
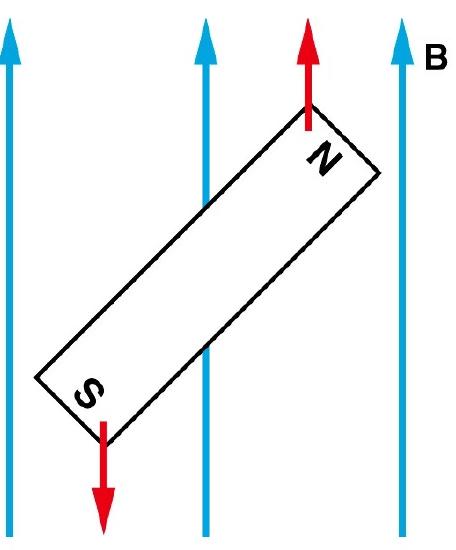
The Action of Magnets
- Magnets are acted on by forces and torques when placed within an external applied magnetic field
- In a uniform external field, a magnet experiences no net force but a net torque
- The torque tried to align the magnetic moment (\(\vec{\mu}_m\)) of the magnet and the external field \(\vec{B}\)
Quantum Effects
- Pieter Zeeman was one of the first to observe the splitting of spectra lines in a magnetic field cause by magnetic field interaction - this effect is now known as the Zeeman effect
- We are going to work on the Zeeman effect for the 2p to 1s transition
- The Zeeman effect uses a magnetic field to remove the degeneracy of different angular momentum states
- Since magnetism results from the circular motion of charged particles, we should look for a relationship between the angular momentum \(\vec{L}\) and the magnetic dipole moment \(\vec{\mu}_m\) (also known simply as the magnetic moment)
- This relationship for a particle of mass \(m\) and charge \(q\) is $$ \begin{equation} \vec{\mu}_m=\frac{q}{2m}\vec{L} \label{eq:8.4.2} \end{equation} $$
Looking at the Relationship
- For an electron our equation becomes $$ \begin{equation} \vec{\mu}_m=-\frac{e}{2m_e} \vec{L} \label{eq:8.4.3} \end{equation} $$
- The magnetic moment for the electron is a vector pointing in the direction opposite to \(\vec{L}\), both of which classically are perpendicular to the plane of the rotational motion
- The relationship between the angular momentum of a particle and its magnetic moment is commonly expressed as a ratio called the gyromagnetic ratio, \(\gamma\) $$\begin{equation} \gamma = \frac{\mu_m}{L} = \frac{q}{2m} \label{eq:8.4.4} \end{equation} $$ $$\begin{equation} \gamma_e = -\frac{e}{2m_e} \label{eq:8.4.5} \end{equation} $$
Example 8.12
Will an electron in the ground state of hydrogen have a magnetic moment? Why or why not?
Example 8.13
Calculate the magnitude of the gyromagnetic ratio for an electron.
Energy of Hydrogen in a Magnetic Field
- We need to add an operator into the Hamiltonian to account for the magnetic field interaction $$ \begin{equation} \hat{\mathcal{H}} = \hat{\mathcal{H}}^0 + \hat{\mathcal{H}}_m \label{eq:8.4.6} \end{equation} $$ where \(\hat{\mathcal{H}}\) is the Hamiltonian operator in the absence of the field
- The magnetic term is defined as $$ \begin{equation} \hat{\mathcal{H}}_m=-\hat{\mu}\cdot \hat{B} = \frac{e}{2m_e}\hat{L}\cdot \vec{B} \label{eq:8.4.7} \end{equation} $$
- The scalar product portion is $$ \begin{equation} \hat{L}\cdot \vec{B} = \hat{L}_x B_x + \hat{L}_yB_y + \hat{L}_zB_z \label{eq:8.4.8} \end{equation} $$
Working with our energy equation
- We can simplify this if the z-axis is defined as the direction of the external field because then \(B_x=B_y=0\) $$ \begin{equation} \hat{\mathcal{H}}=\hat{\mathcal{H}}^0+\frac{eB_z}{2m_e}\hat{L_z} \label{eq:8.4.9} \end{equation} $$ where \(B_z\) is the magnitude of the magnetic field, which is along the z-axis
- To find the effect of the magnetic field on the energy of the hydrogen orbitals, we are going to calculate the expectation value of the energy using the existing hydrogen wavefunctions and the new Hamiltonian operator $$ \begin{equation} \expect{E}=\Braket{\hat{\mathcal{H}}^0} + \frac{eB_z}{2m_e} \Braket{\hat{L}_z} \label{eq:8.4.10} \end{equation} $$
Analyzing Our Energy Equation
$$ \expect{E}=\Braket{\hat{\mathcal{H}}^0} + \frac{eB_z}{2m_e} \Braket{\hat{L}_z} $$
- In our equation $$ \begin{equation} \Braket{\hat{\mathcal{H}}^0}=\int \psi_{n,l,m_l}^* \hat{\mathcal{H}} \psi_{m,l,m_l}d\tau = E_n \label{eq:8.4.11} \end{equation} $$ and $$ \begin{equation} \Braket{\hat{L}_z} = \int \psi_{n,l,m_l}^* \hat{L}_z \psi_{n,l,m_l} d\tau = m_l \hbar \label{eq:8.4.12} \end{equation} $$
Example 8.14
Show that the expectation value \(\expect{\hat{L}_z}=m_l\hbar\).
Analysis of Our Energy
- The expectation value approach provides an exact result in this case because the hydrogen atom wavefuctions are eigenfunctions of both \(\hat{\mathcal{H}}^0\) and \(\hat{L}_z\)
- If this wasn't true, this approach would provide only a first-order estimate of the energy
- First and higher order estimates of the energy are part of a general approach to developing approximate solutions to the Schrödinger equation called perturbation theory (discussed in the next chapter)
- Plugging things in we find that $$ \begin{equation} \expect{E} = E_n + \frac{e\hbar B_z m_l}{2m_e} = E_n + \mu_B B_z m_l \label{eq:8.4.13} \end{equation} $$ where the Bohr magneton, \(\mu_B\) is $$ \begin{equation} \frac{e\hbar}{2m_e}=-\gamma_e \hbar = \mu_B \label{eq:8.4.14} \end{equation} $$
The Bohr Magneton and Magnetic Effects
- The Bohr magneton is taken to be the fundamental magnetic moment
- It has units of \(9.2732\times 10^{-21}\,\frac{erg}{Gauss}\) or \(9.2732\times 10^{-24}\,\frac{Joule}{Tesla}\)
- Equation \eqref{eq:8.4.13} shows that the \(m_l\) quantum number degeneracy of the hydrogen atom is removed by the magnetic field
- This means that the three states \(\psi_{211}\), \(\psi_{21-1}\), and \(\psi_{210}\), which are degenerate in zero field, have different energies in a magnetic field as shown on the next slide
- The \(m_l=0\) state experiences no interaction with the magnetic field
- The \(m_l=1\) state experiences a raising of energy in a magnetic field
- The \(m_l=-1\) state experiences a lowering of energy in a magnetic field
Emission Line Splitting
- Emission when an electron switches from a 2p orbital to a 1s orbital occurs at only one energy in the absence of a magnetic field, but can occur at three different energies in the presence of a magnetic field.
Discovering Electron Spin
- Imagine we have a microwave spectrometer with variable magnetic field capacity
- We try using hydrogen atoms in the instrument with a magnetic field of \(10^4\, Gauss\) and look for absorptions of microwave radiation
- We see absorptions at a frequency of \(28\times 10^9\, Hz\) (\(28\,GHz\))
- This is a very surprising result
- Since out atoms are in the ground state, the lowest energy electronic transition based on our current theory is in the vacuum ultraviolet
- Also, the frequency of the absorption varies in proportion to the magnetic field, just like the Zeeman effect
- However, the 1s orbital has no angular momentum to cause an energy splitting
Microwave Spectrometer
Building an Explanation
- So far our atomic model has accounted for the motion of the electron and proton
- We need to add something that can give rise to an additional Zeeman-like effect
- We need a charged particle with angular momentum to produce a magnetic moment
- We can postulate that our observation results from a motion of the electron that wasn't considered previously - electron spin
- In other words, we have a charged particle spinning on its axis
- With electron spin we have a charge moving in a circle, angular momentum, and a magnetic moment which can interact with the magnetic field to give Zeeman-like effects that we see
Quantum Mechanical Description
- To describe electron spin from a quantum mechanical perspective we must have spin wavefunctions and spin operators
- The properties of the spin states are deduced from experimental observations
- The important feature of the spinning electron is the spin angular momentum vector, which we label \(S\) by analogy with the orbital angular momentum \(L\)
- We define spin angular momentum operators with the same properties that we found for the rotational and orbital angular momentum operators since it is all angular momentum
Aside: Bra-Ket Notation
- Earlier we briefly introduced bra-ket notation which is a way of simplifying how we write the mathematics
- The notation also stems from the matrix-algebra (linear algebra) version of quantum mechanics which we are not tackling
- An expectation value of \(\hat{r}\) can be represented as $$ \Braket{\hat{r}} = \int \psi^* \hat{r} \psi d\tau = \Braket{\psi | \hat{r} | \psi} $$
- Oddly, you can also have just a bra or just a ket... though the ket is much more common
- If you have the operator \(\hat{r}\) operating on the wavefunction we can write it $$ \hat{r}\psi = \hat{r}\Ket{\psi} $$ $$ \text{Schrodinger Equation: }\hat{\mathcal{H}}\psi_n = \hat{\mathcal{H}}\Ket{\psi_n} = E_n\Ket{\psi_n} $$
Back to Our Spin Operators
- We can write angular momentum operators, one of which we have see several times $$ \begin{equation} \hat{L}^2 \Ket{Y_l^{m_l}} = l(l+1)\hbar^2 \ket{Y_l^{m_l}} \label{eq:8.5.1} \end{equation} $$ so by analogy $$ \begin{equation} \hat{S}^2\Ket{\sigma_s^{m_s}} = s(s+1)\hbar^2\Ket{\sigma_s^{m_s}} \label{eq:8.5.2} \end{equation} $$
- We also found $$ \begin{equation} \hat{L}_z \Ket{Y_l^{m_l}} = m_l\hbar \Ket{Y_l^{m_l}} \label{eq:8.5.3} \end{equation} $$ $$ \begin{equation} \hat{S}_z \Ket{\sigma_s^{m_s}} = m_s \hbar \Ket{\sigma_s^{m_s}} \label{eq:8.5.4} \end{equation} $$
Spin Quantum Levels
- We previously found that \(m_l\) ranges from \(-l\) to \(+l\)
- We can therefore conclude that \(m_s\) ranges from \(-s\) to \(+s\)
- In our hypothetical experiment we observed one absorption transition, which means there are only two spin states
- This means that the two values of \(m_s\) must be \(+s\) and \(-s\) and the difference must be one integer step
- Thus $$ \begin{align*} m_{s,f}-m_{s,i} &= 1 \\ (+s) - (-s) &= 1 \\ 2s &= 1 \\ s &= \frac{1}{2} \end{align*} $$
Electron Spin
- We can now conclude that the magnitude of the spin quantum number is \(\frac{1}{2}\)
- The values of \(m_s\) are \(+\frac{1}{2}\) and \(-\frac{1}{2}\)
- The two spin states correspond to spinning clockwise and counter-clockwise with positive and negative projections of the spin angular momentum onto the z-axis
- The state with a positive projection, \(m_s=+\frac{1}{2}\), is called \(\alpha\)
- The state with a negative projection, \(m_s=-\frac{1}{2}\), is called \(\beta\)
- From Equation \eqref{eq:8.5.4}, the magnitude of the z-component of spin angular momentum is $$ \begin{equation} S_z=m_s \hbar \label{eq:8.5.6} \end{equation} $$
- So \(S_z=+\frac{\hbar}{2}\) for the \(\alpha\) state and \(S_z=-\frac{\hbar}{2}\) for the \(\beta\) state
The Spin Wavefunctions
- Even though we don't know their functional forms, the spin wavefunctions are taken to be normalized and orthogonal to each other $$ \begin{equation} \int \alpha^* \alpha d\tau_s = \int \beta^* \beta d\tau_s =1 \label{eq:8.5.7} \end{equation} $$ and $$ \begin{equation} \int \alpha^* \beta d\tau_s = \int \beta^* \alpha d\tau_s =0 \label{eq:8.5.8} \end{equation} $$
Absorption of a Photon by Spin States
Working to Understand Our Transitions
- Let's account for our transition (\(\nu=28\, GHz\))
- The photon energy, \(h\nu\), is given by the difference between the energies of the two states, \(E_\alpha\) and \(E_\beta\) $$ \begin{equation} \Delta E = h\nu = E_\alpha - E_\beta \label{eq:8.5.9} \end{equation} $$
- The energies of these two states consist of the sum of the energy of an electron in a 1s orbital, \(E_{1s}\), and the energy due to the interaction of the spin magnetic dipole moment of the electron, \(\mu_s\), with the magnetic field, \(B\) $$ \begin{align} E_\alpha &= E_{1s} - \mu_{s,\alpha} \cdot B \label{eq:8.5.10} \\ E_\beta &= E_{1s} - \mu_{s,\beta} \cdot B \label{eq:8.5.11} \end{align} $$
Continuing to work towards a transition energy
- Substituting Equations \eqref{eq:8.5.10} and \eqref{eq:8.5.11} into Equation \eqref{eq:8.5.9} $$ \begin{align} h\nu &= E_\alpha - E_\beta = \left( E_{1s}-\mu_{s,\alpha} \cdot B \right) - \left( E_{1s} - \mu_{s,\beta} \cdot B \right) \label{eq:8.5.12} \\ &= \left(\mu_{s,\beta}-\mu_{s,\alpha}\right) \cdot B \label{eq:8.5.14} \end{align} $$
- By analogy to orbital angular momentum and magnetic moment previously discussed (previous section of this chapter), we can relate the spin magnetic dipole to the total spin angular momentum by the spin gyromagnetic ratio $$ \begin{align} \mu_s &= \gamma_s S \label{eq:8.5.15} \\ \mu_{s,\alpha} &= \gamma_s S_\alpha \label{eq:8.5.16} \\ \mu_{s,\beta} &= \gamma_s S_\beta \label{eq:8.5.17} \end{align} $$
Getting Closer to the Transition Energy
- With the magnetic field direction defined as z, the scalar product in Equation \eqref{eq:8.5.14} becomes a product of the z-components
- Inserting \(S_{z,\alpha}=+\frac{1}{2}\hbar\) and \(S_{z,\beta}=-\frac{1}{2}\hbar\) into Equation \eqref{eq:8.5.14} $$ \begin{equation} \frac{h\nu}{B} = -\gamma_s \hbar \label{eq:8.5.18} \end{equation} $$
- We can now calculate the ratio \(\frac{h\nu}{B}\) from our experimental results (\(\nu=28\times 10^9\, Hz\) and \(B=10^4 \, Gauss\)) $$ \begin{equation} -\gamma_s \hbar = 18.5464\times 10^{-21} \frac{erg}{gauss} \label{eq:8.5.19} \end{equation} $$
- Comparing this to the Bohr magneton, \(-\gamma_e \hbar\), gives us the g-factor $$ \begin{equation} \gamma_s = 2.0023\gamma_e \label{eq:8.5.20} \end{equation} $$
Example 8.15
Carry out the calculations that show that the g-factor for electron spin is 2.0023. Interestingly, the concept of electron spin and the value \(g=2.0023\) follow logically from Dirac's relativistic quantum theory, which is beyond the scope of this course.
Spin Selection Rule #1
- We need to determine how the electron spin changes when radiation is absorbed or emitted
- Unlike orbital angular momentum, which can have several values, the spin angular momentum can have only the value $$ \begin{equation} \left| S \right| = \sqrt{s(s+1)\hbar} = \frac{\sqrt{3}}{2}\hbar \label{eq:8.5.21} \end{equation} $$
- Since \(s=\frac{1}{2}\), one spin selection rule is $$\begin{equation} \Delta s= 0 \label{eq:8.5.22} \end{equation} $$
Spin Selection Rule #2
- When a magnetic field is applied along the z-axis to remove the \(m_s\) degeneracy, another magnetic field applied in the x or y direction exerts a force or torque on the magnetic dipole to turn it
- This transverse field can "flip the spin," and change the projection on the z-axis $$ +\frac{1}{2}\hbar \rightarrow -\frac{1}{2}\hbar \text{ or } -\frac{1}{2}\hbar \rightarrow +\frac{1}{2}\hbar $$
- So, our other selection rule for a single electron is $$ \begin{equation} \Delta m_s = \pm 1 \label{eq:8.5.23} \end{equation} $$
Other One-Electron Systems
- The quantum mechanical treatment of the hydrogen atom can be extended easily to other one-electron systems such as \(\chem{He^+}\), \(\chem{Li^{2+}}\), etc.
- The Hamiltonian changes in two places
- Most importantly, the potential energy term is changed to account for the change in the number of protons in the nucleus, \(Z\) $$ \begin{equation} \hat{V}(r) = -\frac{Ze^2}{4\pi \varepsilon_0 r} \label{eq:8.6.1} \end{equation} $$
- The other effect is very slight and is the reduced mass in the kinetic energy operator
Example 8.16
Compare the reduced mass of the \(\chem{Li^{2+}}\) ion to that of the hydrogen atom.
The Results
- Making these corrections, the energy becomes $$ \begin{equation} E_n = -\frac{Z^2 \mu e^4}{8\varepsilon_0^2 h^2 n^2}= Z^2 E_{n,H} \label{eq:8.6.2} \end{equation} $$ where \(E_{n,H}\) is the energy of the hydrogen atom
- The forms of the wavefunctions are identical except for the fact that \(Z\) is not longer equal to 1
- The selection rules are unchanged
- The Zeeman effect still occurs
Example 8.17
Use the orbital energy level expression in Equation \eqref{eq:8.6.2} to predict quantitatively the relative energies (in \(cm^{-1}\)) of the spectral lines for \(\chem{H}\) and \(\chem{Li^{2+}}\).
Comparing the Wavefunctions
- Comparing the 2s wavefunctions, we can see that increasing the atomic number has the effect of compressing the atomic orbitals closer to the nucleus.
Spin-Orbitals and Electron Configurations
- The wavefunctions obtained by solving the hydrogen atom Schrödinger equation are associated with orbital angular motion and are often called spatial wavefunctions to differentiate them from the spin wavefunctions
- The complete wavefuction for an electron in a hydrogen atom must contain both the spatial and the spin components.
- We refer to the complete one-electron orbital as a spin-orbital $$ \begin{equation} \Ket{\phi_{n,l,m_l,m_s}} = \Ket{\psi_{n,l,m_l}(r,\theta,\phi)}\Ket{\sigma_s^{m_s}} \label{eq:8.7.1} \end{equation} $$
- For a \(2p_z\) with \(m_s=+\frac{1}{2}\) $$ \begin{equation} \Ket{\phi_{2p_z\alpha}} = \Ket{\psi_{2,1,0}(r,\theta,\phi)}\Ket{\alpha} \label{eq:8.7.2} \end{equation} $$
Electron Configuration Diagram
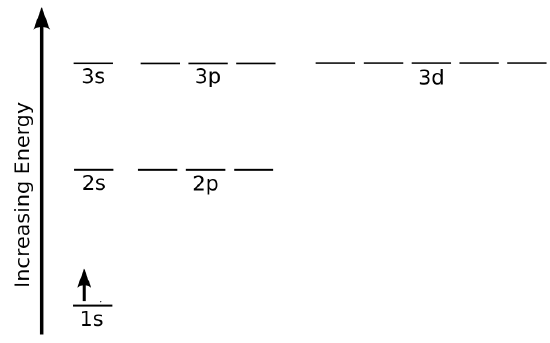
- This is a common representation which gives one representation of the ground state electron configuration of the hydrogen atom
- Alternatively, we could represent the state with numbers and letter as it: \(1s^1\) with excited states such as \(2s^1\), \(3p^1\), etc.
Coupling of Angular Momentum and Spectroscopic Term Symbols
- Around 1930, several spectroscopists using high resolution instruments found that the lines in the hydrogen atom spectrum are actually not single lines but they are multiplets
- A multiplet consists of two or more closely spaced lines
- Two lines form a doublet, three a triplet, etc.
- Multiplets also are called fine structure
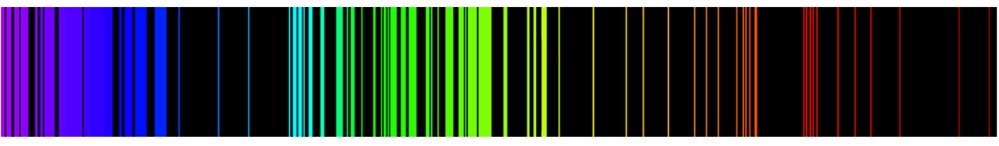
Multiplets of Hydrogen Atom Spectrum
- Note: \(H^1_\alpha\) is hydrogen and \(H^2_\alpha\) is deuterium
- Recall that the \(H_\alpha^1\) line in the Balmer series at \(656.279\, nm\) was understood as resulting from the single transition \(n=3\rightarrow 2\)
- The observation of fine structure revelaed that an orbital energy level diagram does not completely describe the energy levels of atoms
- The fine structure also provided key evidence at the time for the existence of electron spin
Spin-Orbit Coupling
- Specifying the orbital configuration of an atom does not uniquely identify the electronic state of the atom
- This is because the orbital angular momentum, the spin angular momentum, and the total angular momentum are not precisely specified.
- For example, in the hydrogen \(2p^1\) configuration, the electron can be in any of the three p-orbitals, \(m_l=+1,0,-1\) and have spins with \(m_s=+\frac{1}{2}\text{ or }-\frac{1}{2}\) thus there are 6 different possible states
- Also, the orbital and spin angular momentum of the electrons combine in multiple ways to produce angular momentum vectors that are characteristic of the entire atom, not just individual electrons
- These combinations can have different energies
- The coupling of orbital and spin angular momentum occurs because both the electron spin and orbital notion produce magnetic dipole moments
- This interactions is called spin-orbit interaction
Beginning Spin-Orbit Energies
- The interaction energy is proportional to the scalar product of the magnetic dipole moments, which are proportional to the angular momentum vectors $$ \begin{align} E_{s-o} &= \lambda S\cdot L \label{eq:8.8.1} \\ \hat{H}_{s-o} &= \lambda \hat{S}\cdot \hat{L} \label{eq:8.8.2} \end{align} $$ where \(\lambda\) represents the constant of proportionality and is called the spin-orbit coupling constant
- This coupling means that exact wavefunctions are not eigenfunctions of the spin and orbital angular momentum operators separately
- Instead, the total angular momentum \(J=L+S\), the vector sum of the spin and orbital angular momentum is required to be coupled for a completely accurate description of the system
Coupling
- We need to be able to identify the electronic states that result from a given electron configuration and determine their relative energies
- An electronic state is characterized by a specific energy, wavefunction (including spin), electron configuration, total angular momentum, and the way the orbital and spin angular momenta of the different electrons are coupled together
- There are two descriptions for the coupling of angular momentum
- One is called j-j coupling
- The other is called L-S coupling
- j-j coupling scheme is used for heavy elements (\(Z\gt 40\)) and L-S coupling scheme is used for the lighter elements
- L-S Coupling is also called R-S or Russell-Saunders coupling
L-S Coupling
- In L-S coupling, the orbital and spin angular momenta of all the electrons are combined separately $$ \begin{align} L &= \sum_i l_i \label{eq:8.8.3} \\ S &= \sum_i S_i \label{eq:8.8.4} \end{align} $$
- The total angular momentum vector then is the sum of these totals $$ \begin{equation} J=L+S \label{eq:8.8.5} \end{equation} $$
Russell-Saunders Term Symbol
- The result of these vector sums is specified in a code that is called a Russell-Saunders term symbol
- Each term symbol identifies an energy level of the atom, thus energy levels are also called terms
- A term symbol has the form $$ \begin{equation} {}^{2S+1}L_J \label{eq:8.8.6} \end{equation} $$
- The code letter that is used for the total orbital angular member quantum number \(L=0,1,2,3,4,5\) is S, P, D, F, G, H, respectively
- The superscript \(2S+1\) gives the spin multiplicity of the state, where \(S\) is the total spin angular momentum quantum number
Russell-Saunders Term Symbols Continued
- In the term symbol, the subscript \(J\) gives the total angular momentum quantum number
- Because of spin-orbit coupling, only \(J\) and \(M_J\) are valid quantum numbers
- However, because the spin-orbit coupling is weak, \(L\), \(M_L\), \(S\) and \(M_S\) still serve to identify and characterize the states of lighter elements
- Example, the ground state of hydrogen atom
- The electron occupies the 1s spatial orbital and either \(\alpha\) or \(\beta\) spin
- \(S=\frac{1}{2}\) so \(2S+1=2\)
- \(L=0\) so the code is S
- \(J=L+S=0+\frac{1}{2}=\frac{1}{2}\)
- So the term is \({}^2S_{\frac{1}{2}}\) - this is read as "doublet S \(\frac{1}{2}\)"
- Note: Because of vector addition, the magnitude of \(J\) is \(J=\left| L-S \right|, \dots , L+S\)
Example 8.18
Write the term symbol for a state that has 0 for both the spin and orbital angular momentum quantum numbers.
Example 8.19
Write the term symbols for a state that has 0 for the spin and 1 for the orbital angular momentum quantum numbers.
Russell-Saunders Selection Rules
- Higher energy or excited orbital configurations also exist
- These excited electronic states are also characterized or labeled by term symbols
- Based on our \(l\) and \(m_l\) selection rules (Equation \eqref{eq:8.3.7}) we find that for an atom as a whole, in the limit of L-S coupling, the Russell-Saunders selection rules are
$$ \begin{align}
\Delta S &= 0 \label{eq:8.8.9} \\
\Delta L &= 0, \pm 1 \label{eq:8.8.10} \\
\Delta J &= 0, \pm 1 \label{eq:8.8.11} \\
\Delta m_J &= 0, \pm 1 \label{eq:8.8.12}
\end{align} $$
- Note: the \(J=0\) to \(J=0\) transition is forbidden
- Note: the \(m_J=0\) to \(m_J=0\) is forbidden if \(\Delta J=0\)
Applying These Ideas
- We want to apply these ideas to understand why multiplet structure is found in the the hydrogen spectrum
- As we have said, the \(H_\alpha\) line in the Balmer series at \(656.279\, nm\) can be understood as due to a \(n=3 \rightarrow n=2\) transition
- Examining this line we get a doublet separated by \(0.326\, cm^{-1}\)
- There are 9 degenerate orbitals associated with the \(n=3\) level and 4 associated with the \(n=2\) level
- Since an electron can be in any orbital with any one of two spins, we expect the total number of states to be twice the number of orbitals
- So there should be 8 states for \(n=2\) and 18 states for \(n=3\)
- The table on the following slide lists the terms that result from having an electron in any one of these orbitals
H Atom Terms Originating from \(n=1,2,\text{ and }3\)
| Orbital Configuration | Term Symbols | Degeneracy |
|---|---|---|
| \( 1s^1 \) | \( {}^2S_\frac{1}{2} \) | \( 2 \) |
| \( 2s^1 \) | \( {}^2S_\frac{1}{2} \) | \( 2 \) |
| \( 2p^1 \) | \( {}^2P_\frac{1}{2},\, {}^2P_\frac{3}{2} \) | \( 2,\, 4 \) |
| \( 3s^1 \) | \( {}^2S_\frac{1}{2} \) | \( 2 \) |
| \( 3p^1 \) | \( {}^2P_\frac{1}{2},\, {}^2P_\frac{3}{2} \) | \( 2,\, 4 \) |
| \( 3d^1 \) | \( {}^2D_\frac{3}{2},\, {}^2D_\frac{5}{2} \) | \( 4,\, 6 \) |
- The degeneracy of each terms is determined by the number of projections that the total angular momentum vector has on the z-axis
- These projections depend on the \(m_J\) quantum number, which ranges from \(+J\) to \(-J\) in integer steps
Example 8.20
Confirm that the term symbols in the previous table are correct.
Example 8.21
Confirm that the values of the degeneracy in the previous table are correct and that the total number of states add up to 8 for \(n=2\) and 18 for \(n=3\).
Energies of Terms
- The energies of the terms depends upon spin-orbit coupling and relativistic corrections that need to be included in the Hamiltonian
- As a consequence of these effects, all terms with the same \(n\) and \(J\) quantum numbers have the same energy
- Terms with different values for \(n\) or \(J\) have different energies
Analysis of the Transitions
- There are 5 allowed transition for the electrons between our two states
- Of these five, two are most intense and are responsible for the doublet structure
- The other transitions contribute to the width of these lines or are not observed
Magnetic Field Effects
- The Zeeman effect previously only considered the orbital motion of the electron and ignored the spin angular momentum
- We can get some information on a more complete Zeeman effect by using the term symbols
- As we have seen, the \(2p^1\) configuration produces \({}^2P_\frac{3}{2}\) and \({}^2P_\frac{1}{2}\) terms with the latter being lower in energy by \(0.364\, cm^{-1}\)
- The \(1s^1\) configuration corresponds to a \({}^2S_\frac{1}{2}\) terms
- Orbital energy in a magnetic field was given previously, and is $$ \begin{equation} \expect{E} = E_0 + \mu_B B_zm_l \label{eq:8.8.13} \end{equation} $$
- This can be generalized by changing to \(J\) and adding the g-factor $$ \begin{equation} \expect{E} = E_0 + gm_J \mu_B B_z \label{eq:8.8.14} \end{equation} $$
Further Analysis of Our Equation
- The g-factor equals about 2 for a free electron or an electron in a s-orbital
- The g-factor of an electron is affected by spin-orbit coupling
- For the case of L-S coupling $$ \begin{equation} g=1+\frac{J(J+1)+S(S+1)-L(L+1)}{2J(J+1)} \label{eq:8.8.15} \end{equation} $$
- To identify how the energy of states change in a magnetic field, we need only consider the \(g\), \(m_J\) factor in Equation \eqref{eq:8.8.14} since \(\mu_B\) is a constant and the energy change scales with \(B_z\)
- Thus we can describe the splittings in terms of \(gm_J\) units where one \(gm_J\) unit is the product of \(\mu_B B_z\)
Items for the Zeeman Effect Analysis
| Term | \(J\) | \(L\) | \(S\) | \(g\) | \(m_J\) | \(g\, m_J\) |
|---|---|---|---|---|---|---|
| \( {}^2P_\frac{3}{2} \) | \( \frac{3}{2} \) | \( 1 \) | \( \frac{1}{2} \) | \( \frac{4}{3} \) | \( \frac{3}{2} \) | \( \frac{6}{3} \) |
| \( \frac{1}{2} \) | \( \frac{2}{3} \) | |||||
| \( -\frac{1}{2} \) | \( -\frac{2}{3} \) | |||||
| \( -\frac{3}{2} \) | \( -\frac{6}{3} \) | |||||
| \( {}^2P_\frac{1}{2} \) | \( \frac{1}{2} \) | \( 1 \) | \( \frac{1}{2} \) | \( \frac{2}{3} \) | \( \frac{1}{2} \) | \( \frac{1}{3} \) |
| \( -\frac{1}{2} \) | \( -\frac{1}{3} \) | |||||
| \( {}^2S_\frac{1}{2} \) | \( \frac{1}{2} \) | \( 0 \) | \( \frac{1}{2} \) | \( 2 \) | \( \frac{1}{2} \) | \( 1 \) |
| \( -\frac{1}{2} \) | \( -1 \) |
Black-Body Distributions

/