Lecture 12
Reaction Reates and Chemical Equilibrium
Shaun Williams, PhD
Reaction Rates
- A measure of how fast a reaction occurs
- Conditions that affect reaction rate:
- Temperature - Higher temperatures generally cause reactions to move faster
- Reactant concentration - Increasing the concentration of a reactant generally increases the reaction rate
More Conditions that Effect Reaction Rates
- Surface area - Increasing the surface area increases the reaction rate if the reactant is a solid
- Presence of a catalyst - Increases the rate of the reaction
Example of Reaction Rates

Collision Theory
- States that in order for a reaction to occur, reactant molecules must collide in the proper orientation and with sufficient energy
- Which of the pictures on the right has the molecules in the proper orientation to collide?

Energy Diagrams

Activation Energy
- Reactants must overcome an energy barrier before they can change to products
- Energy is required to break bonds in reactants before the reactants can be converted into products
- The minimum amount of energy needed to overcome the energy barrier is called the activation energy, \(E_a\)
- Reactions with large activation energies tend to be slow because a relatively small fraction of reactants have sufficient energy for an effective collision
- Reactions with small activation energies tend to be fast because a large fraction of reactants have sufficient energy for an effective collision
Activated Complex
- Activated complex
- Short-lived, unstable, high-energy chemical species that must be achieved before products can form
- Formed from reactant molecules that collide with the proper orientation and sufficient energy
- Actual structure is unknown
- Each reaction has its own reaction diagram, which shows the amount of energy required to form the activated complex as the reaction progresses
Energy Diagram for a Reaction

Conditions that Affect Reaction Rates
Concentration
- An increase in concentration of one or more of the reactants increases the number of reactants per unit volume
- More molecules are thus closer together and the number of collision per unit time increases
- As total collisions increase, the number of molecules with the energy and orientation required for the reaction also increases
- The fraction of effective collisions remains the same, because the temperature and kinetic energy are constant
Concentration and Reaction Rates

Temperature
- The average kinetic energy of a substance increases as the temperature increases.
- An increase in kinetic energy causes the reaction rate to increase.
- An increase in kinetic energy causes the reaction rate to increase in two ways:
- Increases collision rate - Molecules move faster at higher temperatures, and therefore collide more frequently
- Increases the fraction of effective collisions - More of the molecules attain activation energy because the average kinetic energy of the molecules increases
Temperature and Collision Theory

Catalysis
- Lower the activation energy for the reaction by forming new activated complexes with lower activation energies
- Remain unchanged after the reaction

Enzymes
- Molecules that catalyze specific reactions within living organisms
- Most enzymes are large protein molecules with molar masses between 12,000 and 40,000 g/mol
- Enzymes contain depressions, or holes, called active sites
- The shape of an active site is unique to only one specific kind of reactant molecule, called a substrate

Enzyme Catalysis

Reaction Intermediates
- A molecule or compound that forms temporarily during a reaction
- In any reaction that occurs in more than one step, intermediates and catalysts are not part of the net (or overall) equation.
Chemical Equilibrium
- A state reached by a chemical reaction where there is no change in the concentrations of reactants and products
- Established when a single reaction occurs in which reactants are converted to products, and those products are converted back to reactants in a reverse process at an equal rate.
- The rates of the forward and reverse reactions are equal; there is no net change in the concentrations of reactants and products.
- True equilibria are obtained in closed containers, where reactants and products cannot escape.
- Reactions that can reach equilibrium must be reversible reactions.
- Equilibrium is represented with an equilibrium arrow ( \(\rightleftharpoons\) ) as in the example below: \[ \chem{N_2O_4(g) \rightleftharpoons 2NO_2(g)} \]
Observing a Chemical Equilibrium


Position of Equilibrium
- When a reaction reaches equilibrium, amounts of reactants and products may be about equal (they usually are not though).
- When we describe the equilibrium in terms of which side it favors, products or reactants, we are describing the position of equilibrium.
- Two cases can occur when products and reactants are not equal:
- Large amount of reactants and a small amount of products - We say equilibrium favors reactants in this case.
- Small amount of reactants and a large amount of products - We say equilibrium favors products in this case.
The Equilibrium Constant
- A constant (\(K_{eq}\)) for a specific reaction whose value is always the same at a specified temperature.
- For a reaction with the general form: \[ \chem{aA+bB \rightleftharpoons cC+dD} \] The equilibrium constant expression is: \[ K_{eq} = \frac{\left[C\right]^c\left[D\right]^d}{\left[A\right]^a\left[B\right]^b} \] where \( [A] \), \( [B] \), \( [C] \), and \( [D] \) are the molar concentrations of the reactants and products at equilibrium, and the exponents \(a\), \(b\), \(c\), and \(d\) are the values of the coefficients in the balanced chemical equation.
Equilibrium Constant
- The value of the equilibrium constant tells us about the position of equilibrium.
- When the value is much greater than 1, there are more products than reactants at equilibrium.
- When the value is less than 1, there are more reactants than products at equilibrium.

The Meaning of the Value of \(K_{eq}\)
| Value of \(K_{eq}\) | Position of Equilibrium |
|---|---|
| \(K_{eq} \gg 1\) | Lies to right. Reaction is product favored. |
| \(K_{eq} \ll 1\) | Lies to left. Reaction is reactant favored. |
| \(K_{eq} = 1\) | Lies in middle. Similar amounts of reactants and products. |
Predicting the Direction of a Reaction
- Suppose we start a reaction with a mixture of reactants and products.
- If the relative amounts of reactants and products are at equilibrium concentrations, the system will remain at equilibrium and no net reaction will occur.
- If the relative amounts are not at equilibrium concentrations, a forward or reverse reaction will occur until concentrations are equilibrium concentrations, as described by the equilibrium constant.
Predicting the Direction of a Reaction (cont.)
- Start with more products than there should be at equilibrium
- The reaction will proceed in the reverse direction until the system reaches equilibrium.
- Start with more reactants than there should be at equilibrium
- The reaction will proceed in the forward direction until the system reaches equilibrium.
Heterogeneous Equilibrium
- Homogeneous equilibrium
- An equilibrium in which reactants and products are in the same physical state
- Heterogeneous equilibrium
- An equilibrium in which reactants and products are not in the same physical states
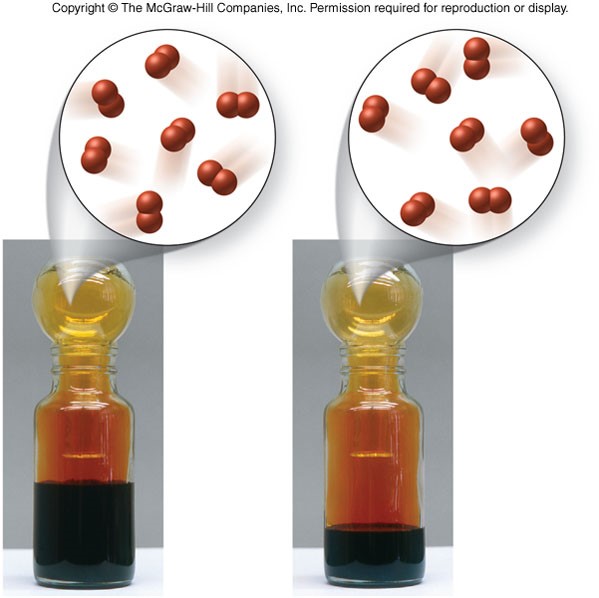
- When finding the equilibrium constant expression for any equilibrium, omit pure liquids and solids.
- Use only gases (g) and dissolved substances (aq) in the equilibrium constant expression.
Heterogeneous Equilibrium (cont.)
- Consider the reaction: \[ \chem{Br_2(l) \rightleftharpoons Br_2(g)} \]
Le Châtelier's Principle
- States that if a system at equilibrium is disrupted, it shifts to establish a new equilibrium.
- Changes that can disrupt a system include:
- Changes in the concentration of a reactant or product
- Changes in the volume of a gas-reaction container
- Temperature changes
Changes in Concentration
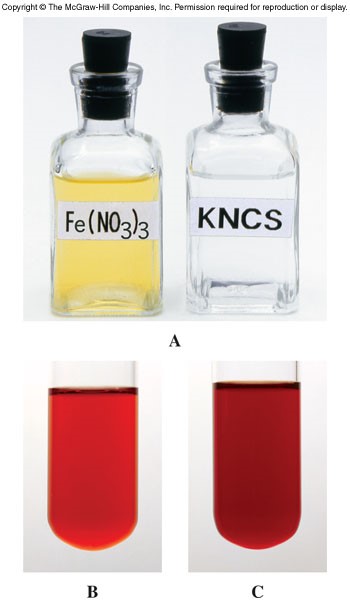
- For a system at equilibrium, when the concentration of a reactant or product is increased, the equilibrium will shift to consume the added substance.
- When the concentration of a reactant or product is reduced, the equilibrium will shift to produce more of the removed substance.
Effects of Changes in Concentration
General reaction: \[ \chem{A(g)+B(g) \rightleftharpoons C(g)+D(g)} \]
| Add reactant | Add product | Remove reactant | Remove product |
|---|---|---|---|
| shift right | shift left | shift left | shift right |
Changes in Volume
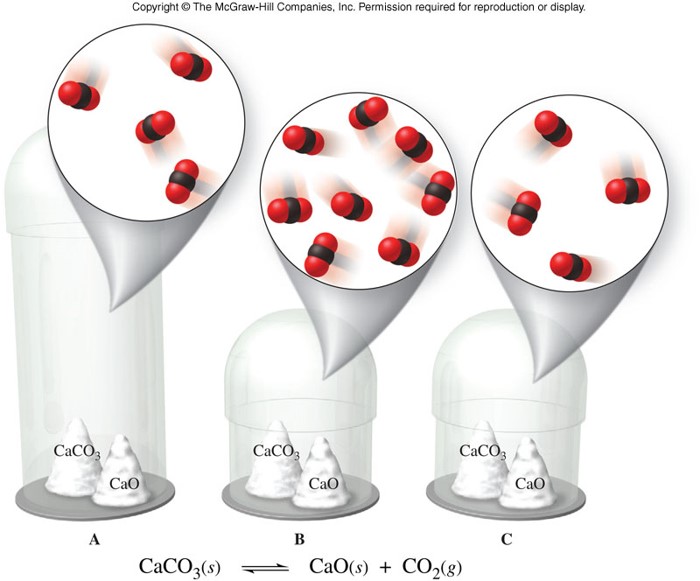
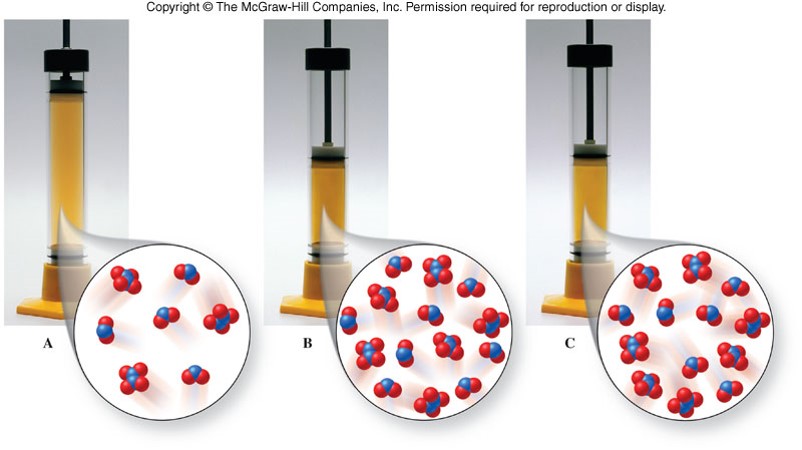
- Because gases expand to fill a container, changes in volume affect the concentrations of any gases in the reaction container.
Example of Changes in Volume
Equilibrium Shifts Due to Changes in Volume
| Relative Number of Gaseous Molecules | Increase Volume | Decrease Volume |
|---|---|---|
| Reactants > Products | shift right | shift left |
| Reactants < Products | shift left | shift right |
| Reactants = Products | no shift | no shift |
Changes in Temperature
- When a reaction is endothermic (heat requiring), you can think of the heat required as an additional reactant. Therefore, put heat as a reactant on the left side of the arrow. \[ \chem{heat + N_2O_4(g) \rightleftharpoons 2NO_2(g)} \]
- When a reaction is exothermic (heat producing), you can think of the heat produced as an additional product. Put heat as a product on the right side of the arrow. \[ \chem{N_2(g) + 3H_2(g) \rightleftharpoons 2NH_3(g) + heat} \]
Example of Changes in Temperature
\[ \chem{heat + N_2O_4(g) \rightleftharpoons 2NO_2(g)} \]
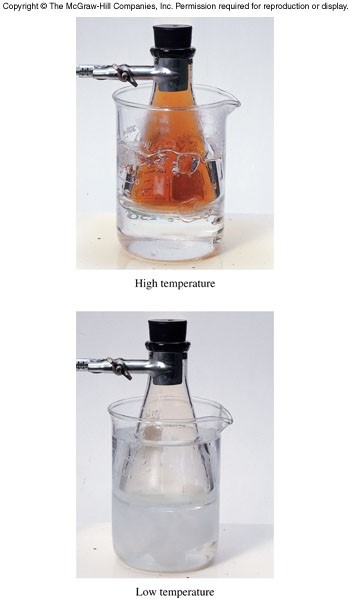
Equilibrium Shifts Due to Temperature Changes
| Type of Reaction | Equation | Increase temperature | Decrease temperature |
|---|---|---|---|
| endothermic | \( \chem{heat + A + B \rightleftharpoons C+D} \) | shift right, \(K_{eq}\) increases | shift left, \(K_{eq}\) decreases |
| exothermic | \( \chem{A + B \rightleftharpoons C+D+heat} \) | shift left, \(K_{eq}\) decreases | shift right, \(K_{eq}\) increases |
Catalysts and Increasing Product Yield
- Catalysts
- Do not change the position of equilibrium or affect a system that is in a state of equilibrium
- Catalysts are neither reactants nor products in the net reaction
- Do not change the position of equilibrium or affect a system that is in a state of equilibrium
- Increasing product yield
- Le Châtelier's Principle can be used to impose conditions in the reaction environment that shift the equilibrium toward the product side of the reaction.
/