First Mesh of the Summer
Reproducibility Test
A Big Problem
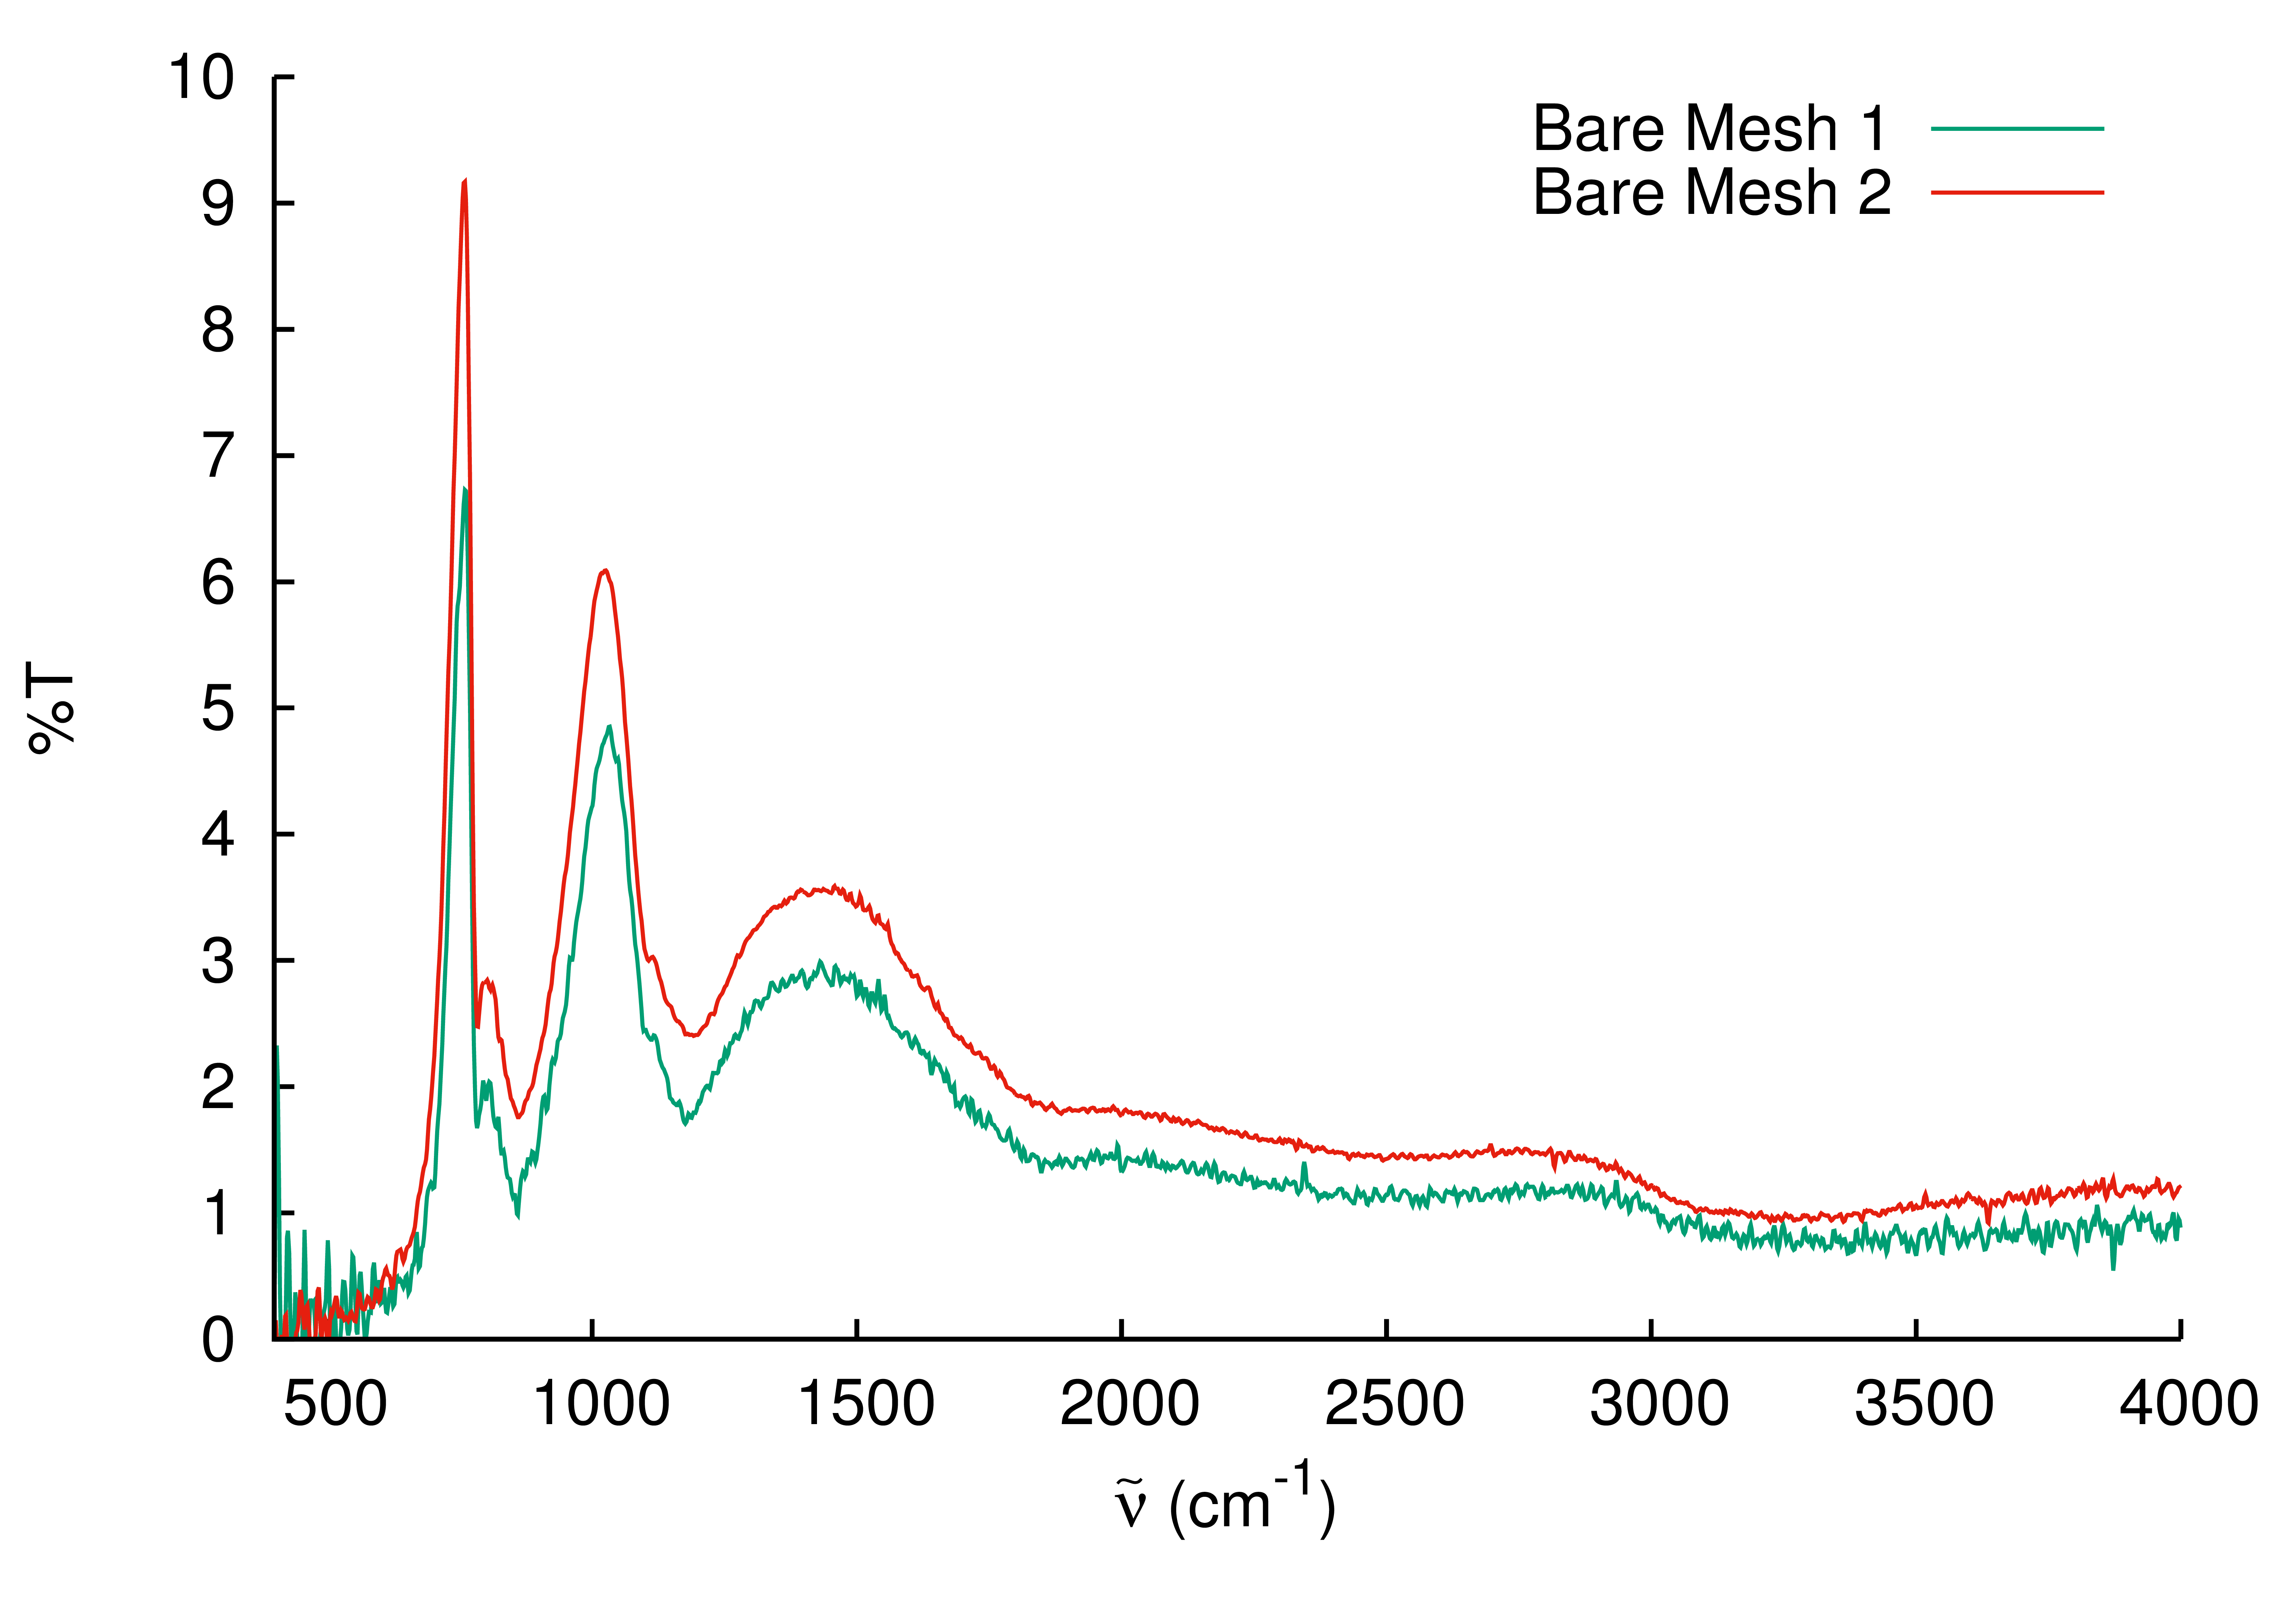
- Same original mesh dimensions
- Same deposition time
- Time was measures with wristwatch
- Accurate to at best a half-second
- Better control of deposition time is clearly needed
A Big Problem
- Same original mesh dimensions
- Same deposition time
- Time was measures with wristwatch
- Accurate to at best a half-second
- Better control of deposition time is clearly needed
A Big Problem
- Same original mesh dimensions
- Same deposition time
- Time was measures with wristwatch
- Accurate to at best a half-second
- Better control of deposition time is clearly needed
Design of a Timer
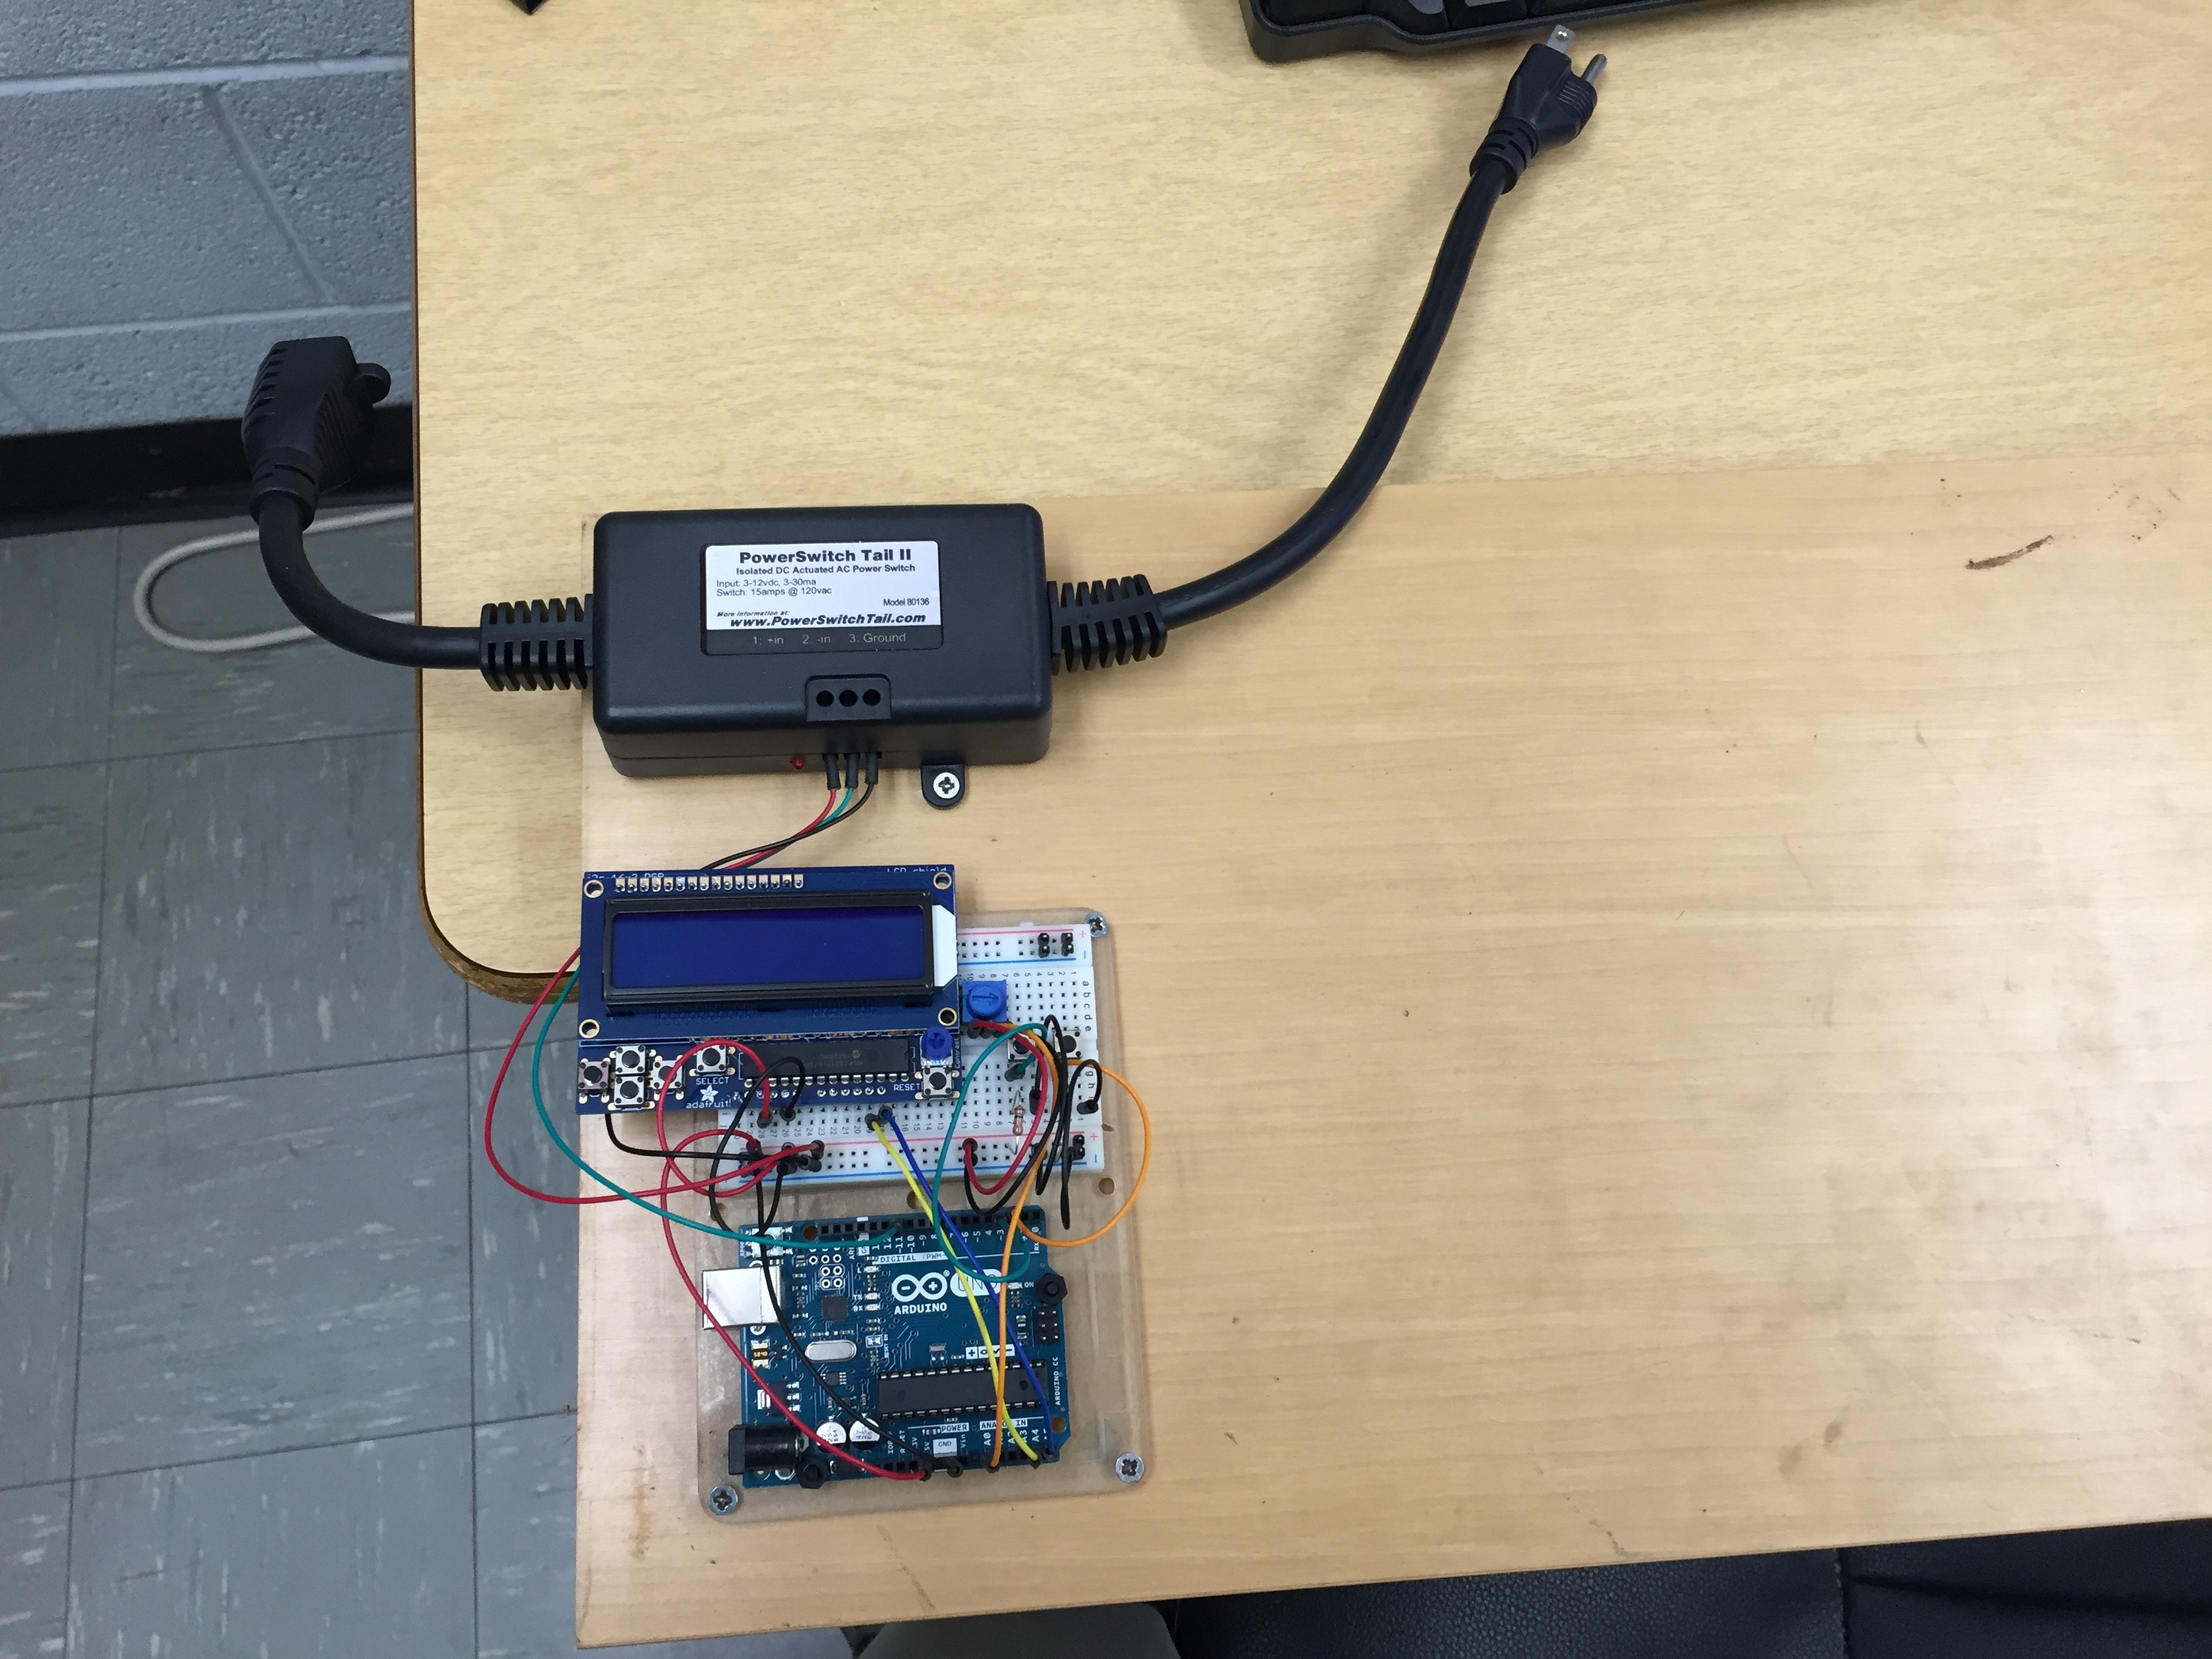
- Arduino electronic control board (bottom in image)
- Hand coded
- Time accuracy of 1 millisecond
- Control breadboard (middle in image)
- Power controller (top in image)
- Program triggers this on an off as appropriate
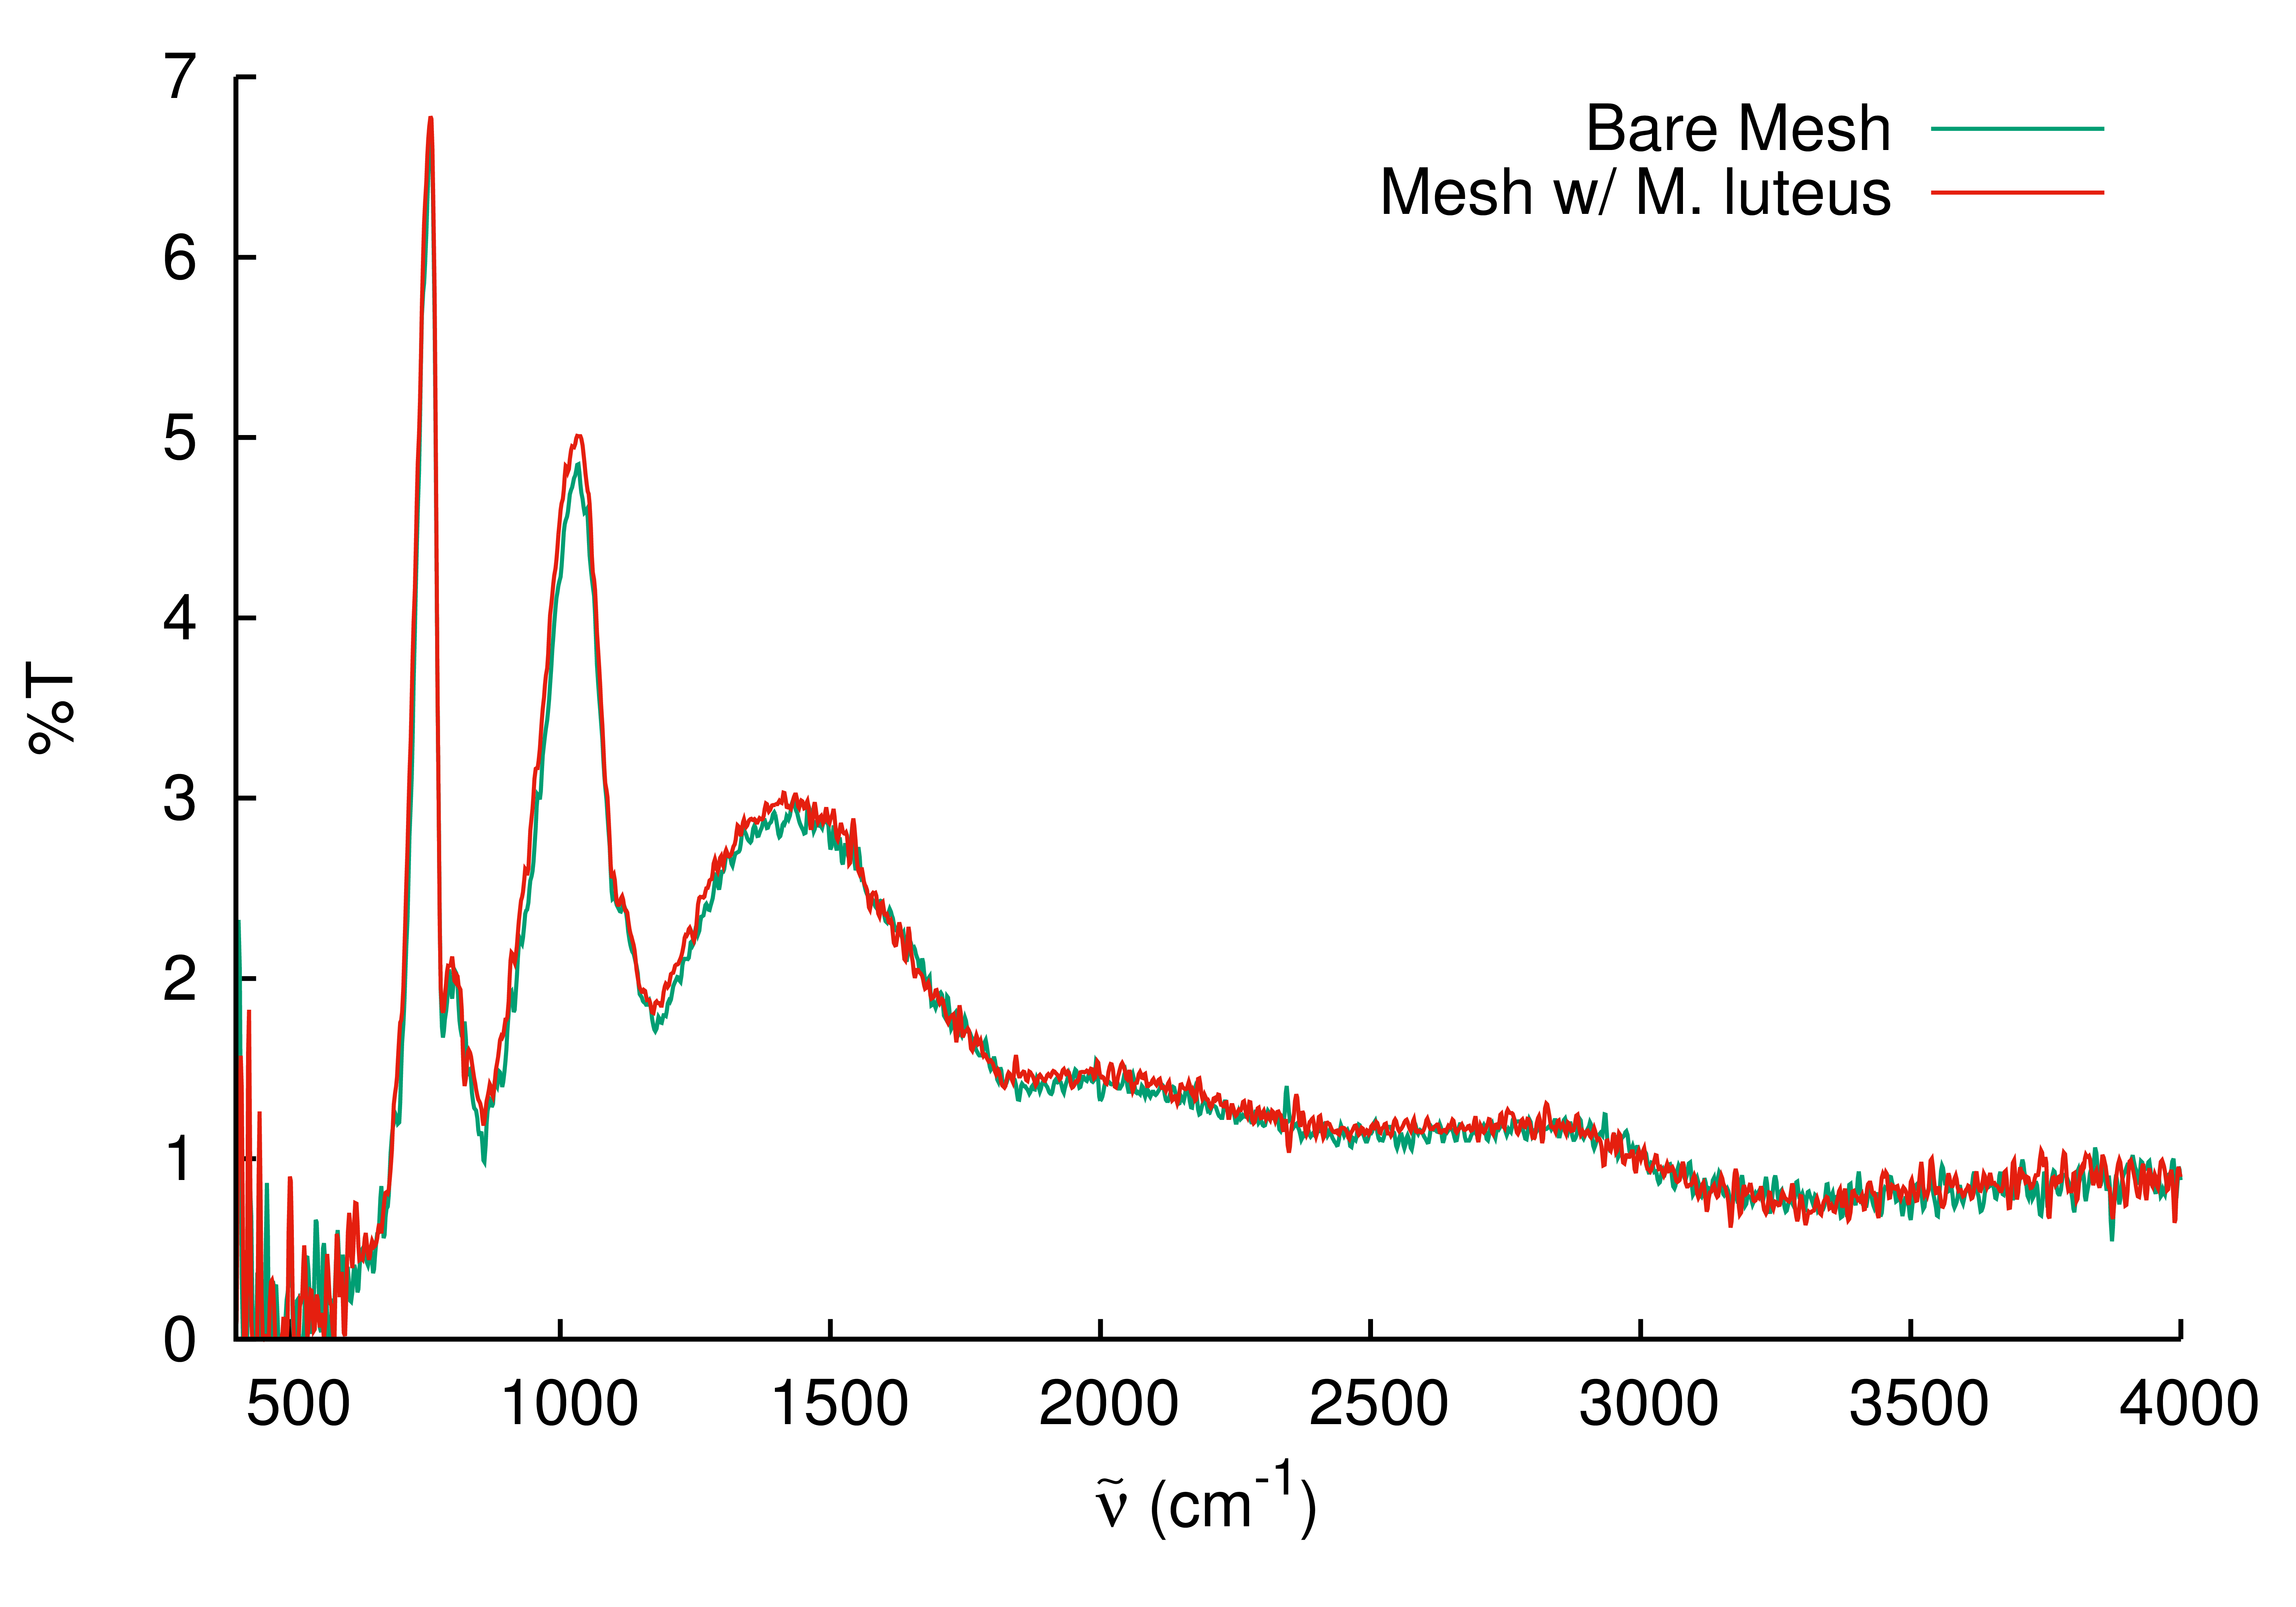
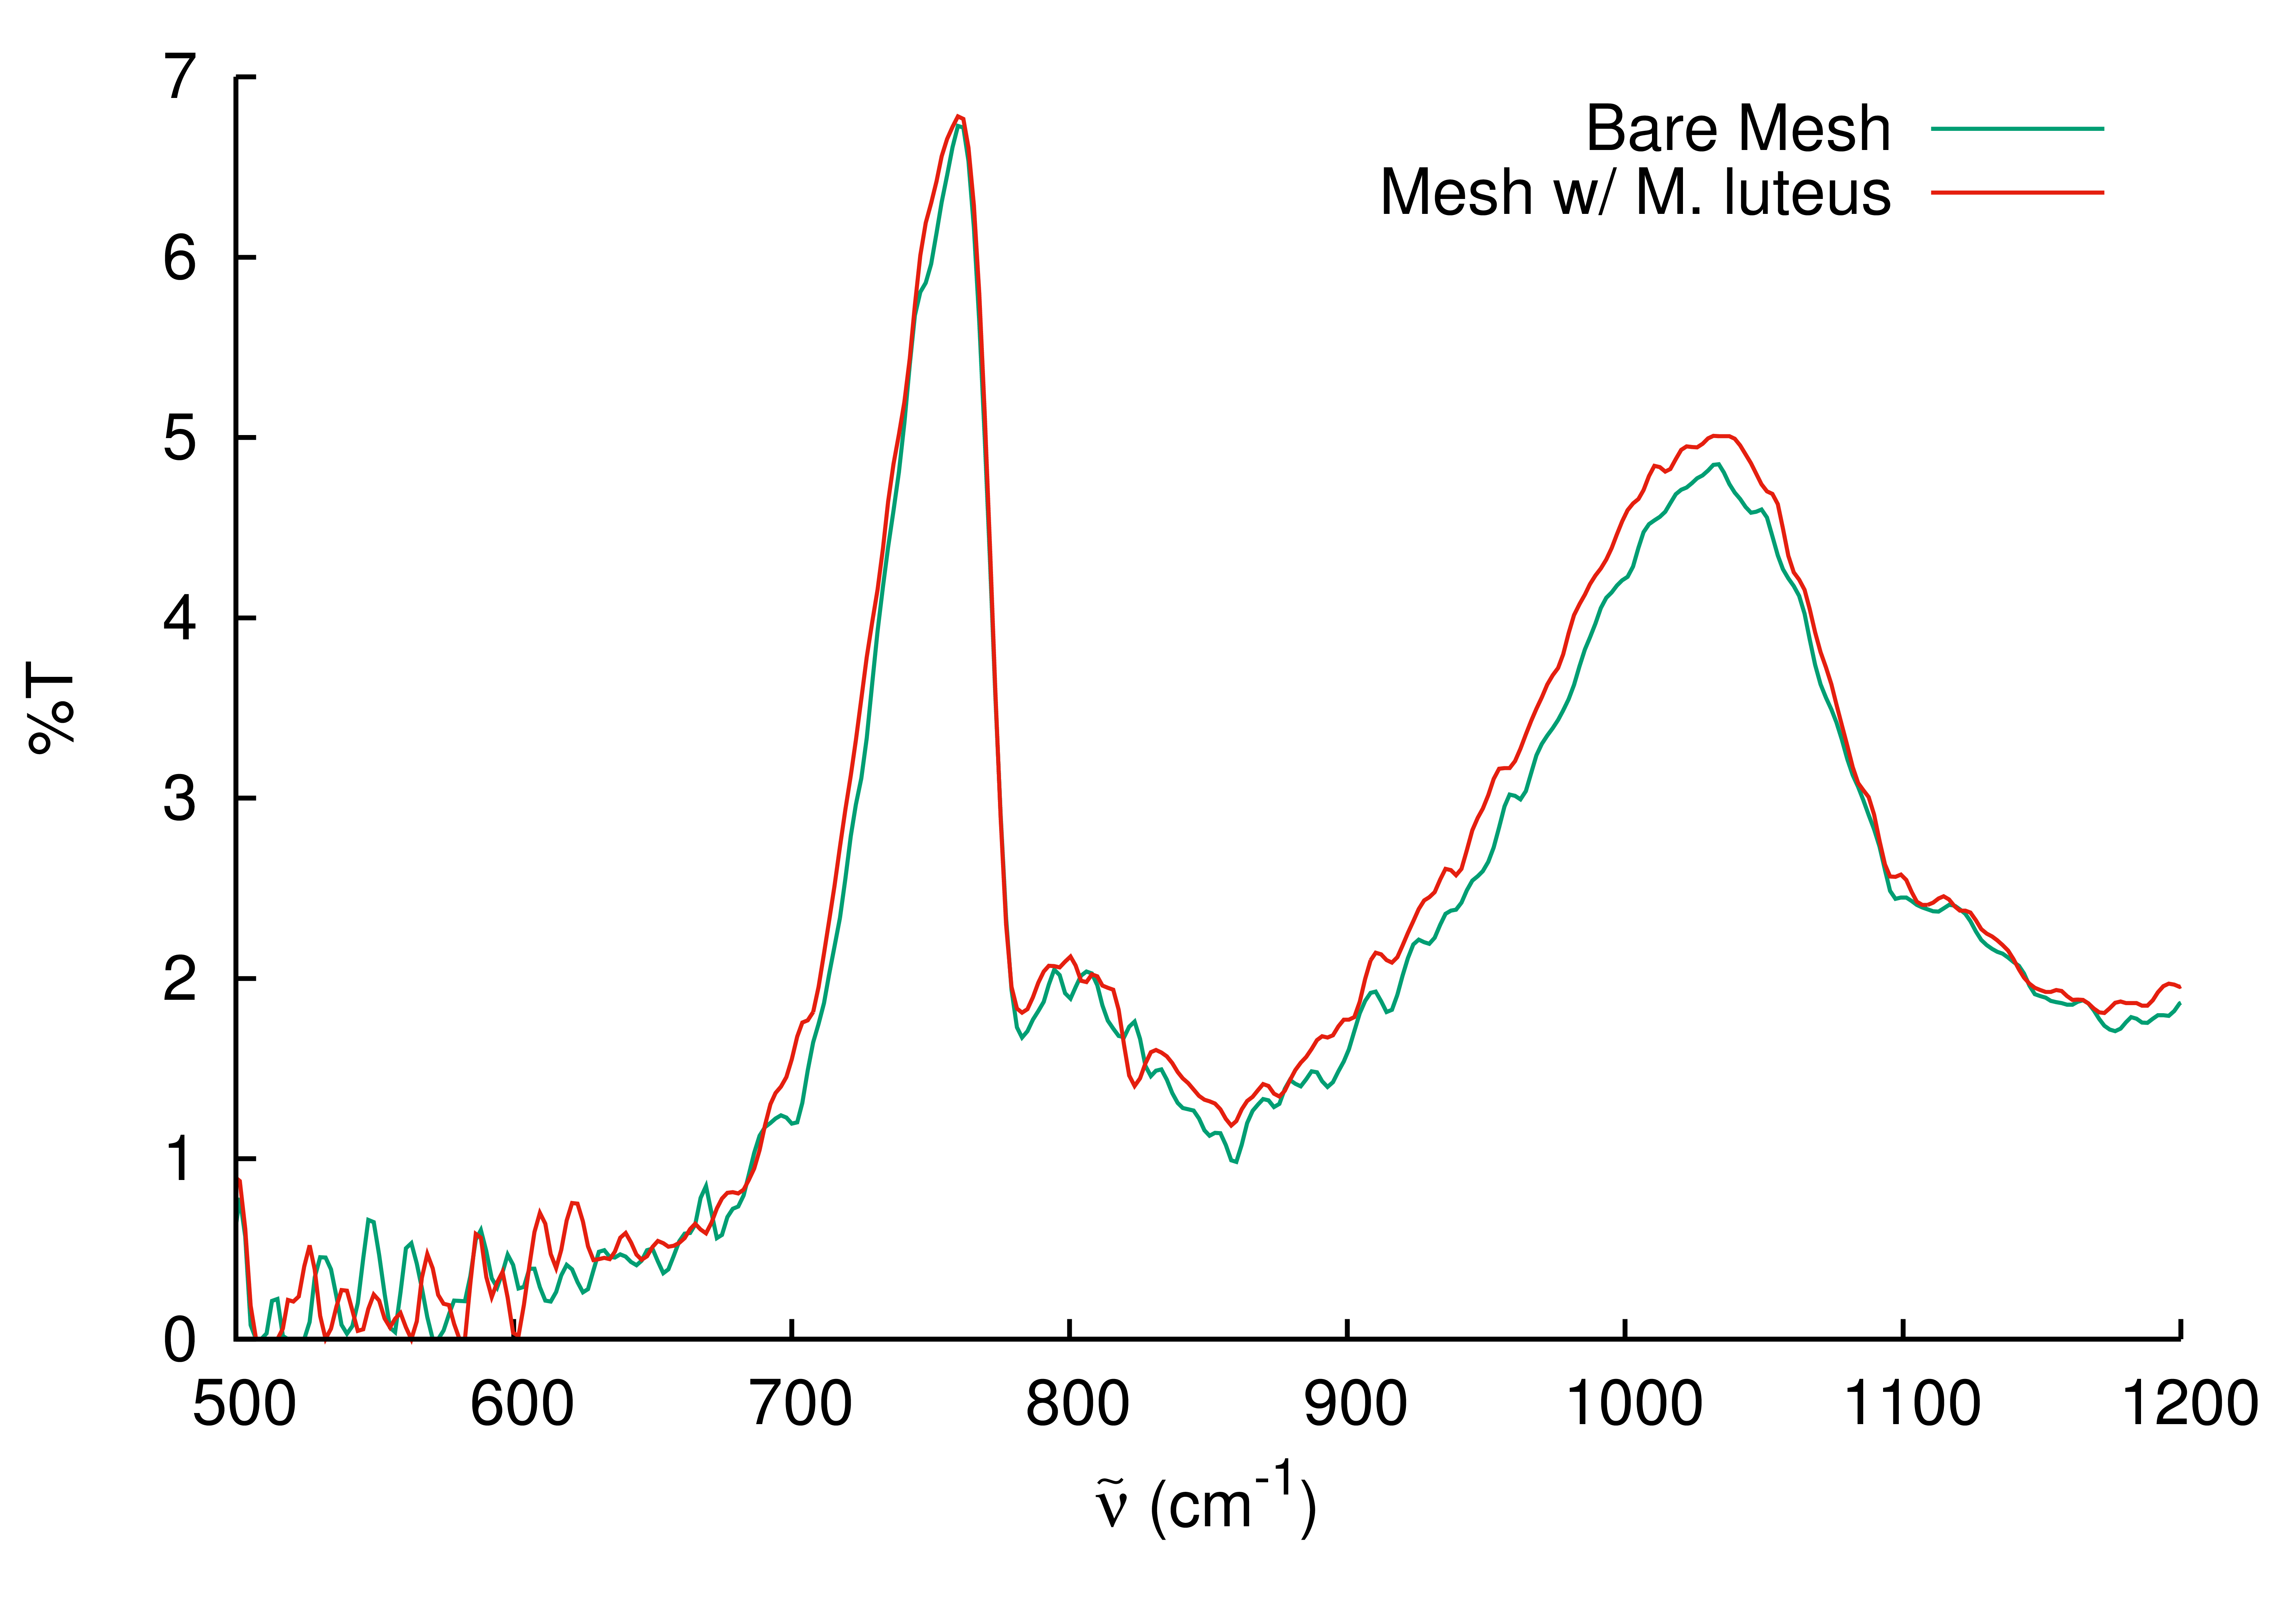
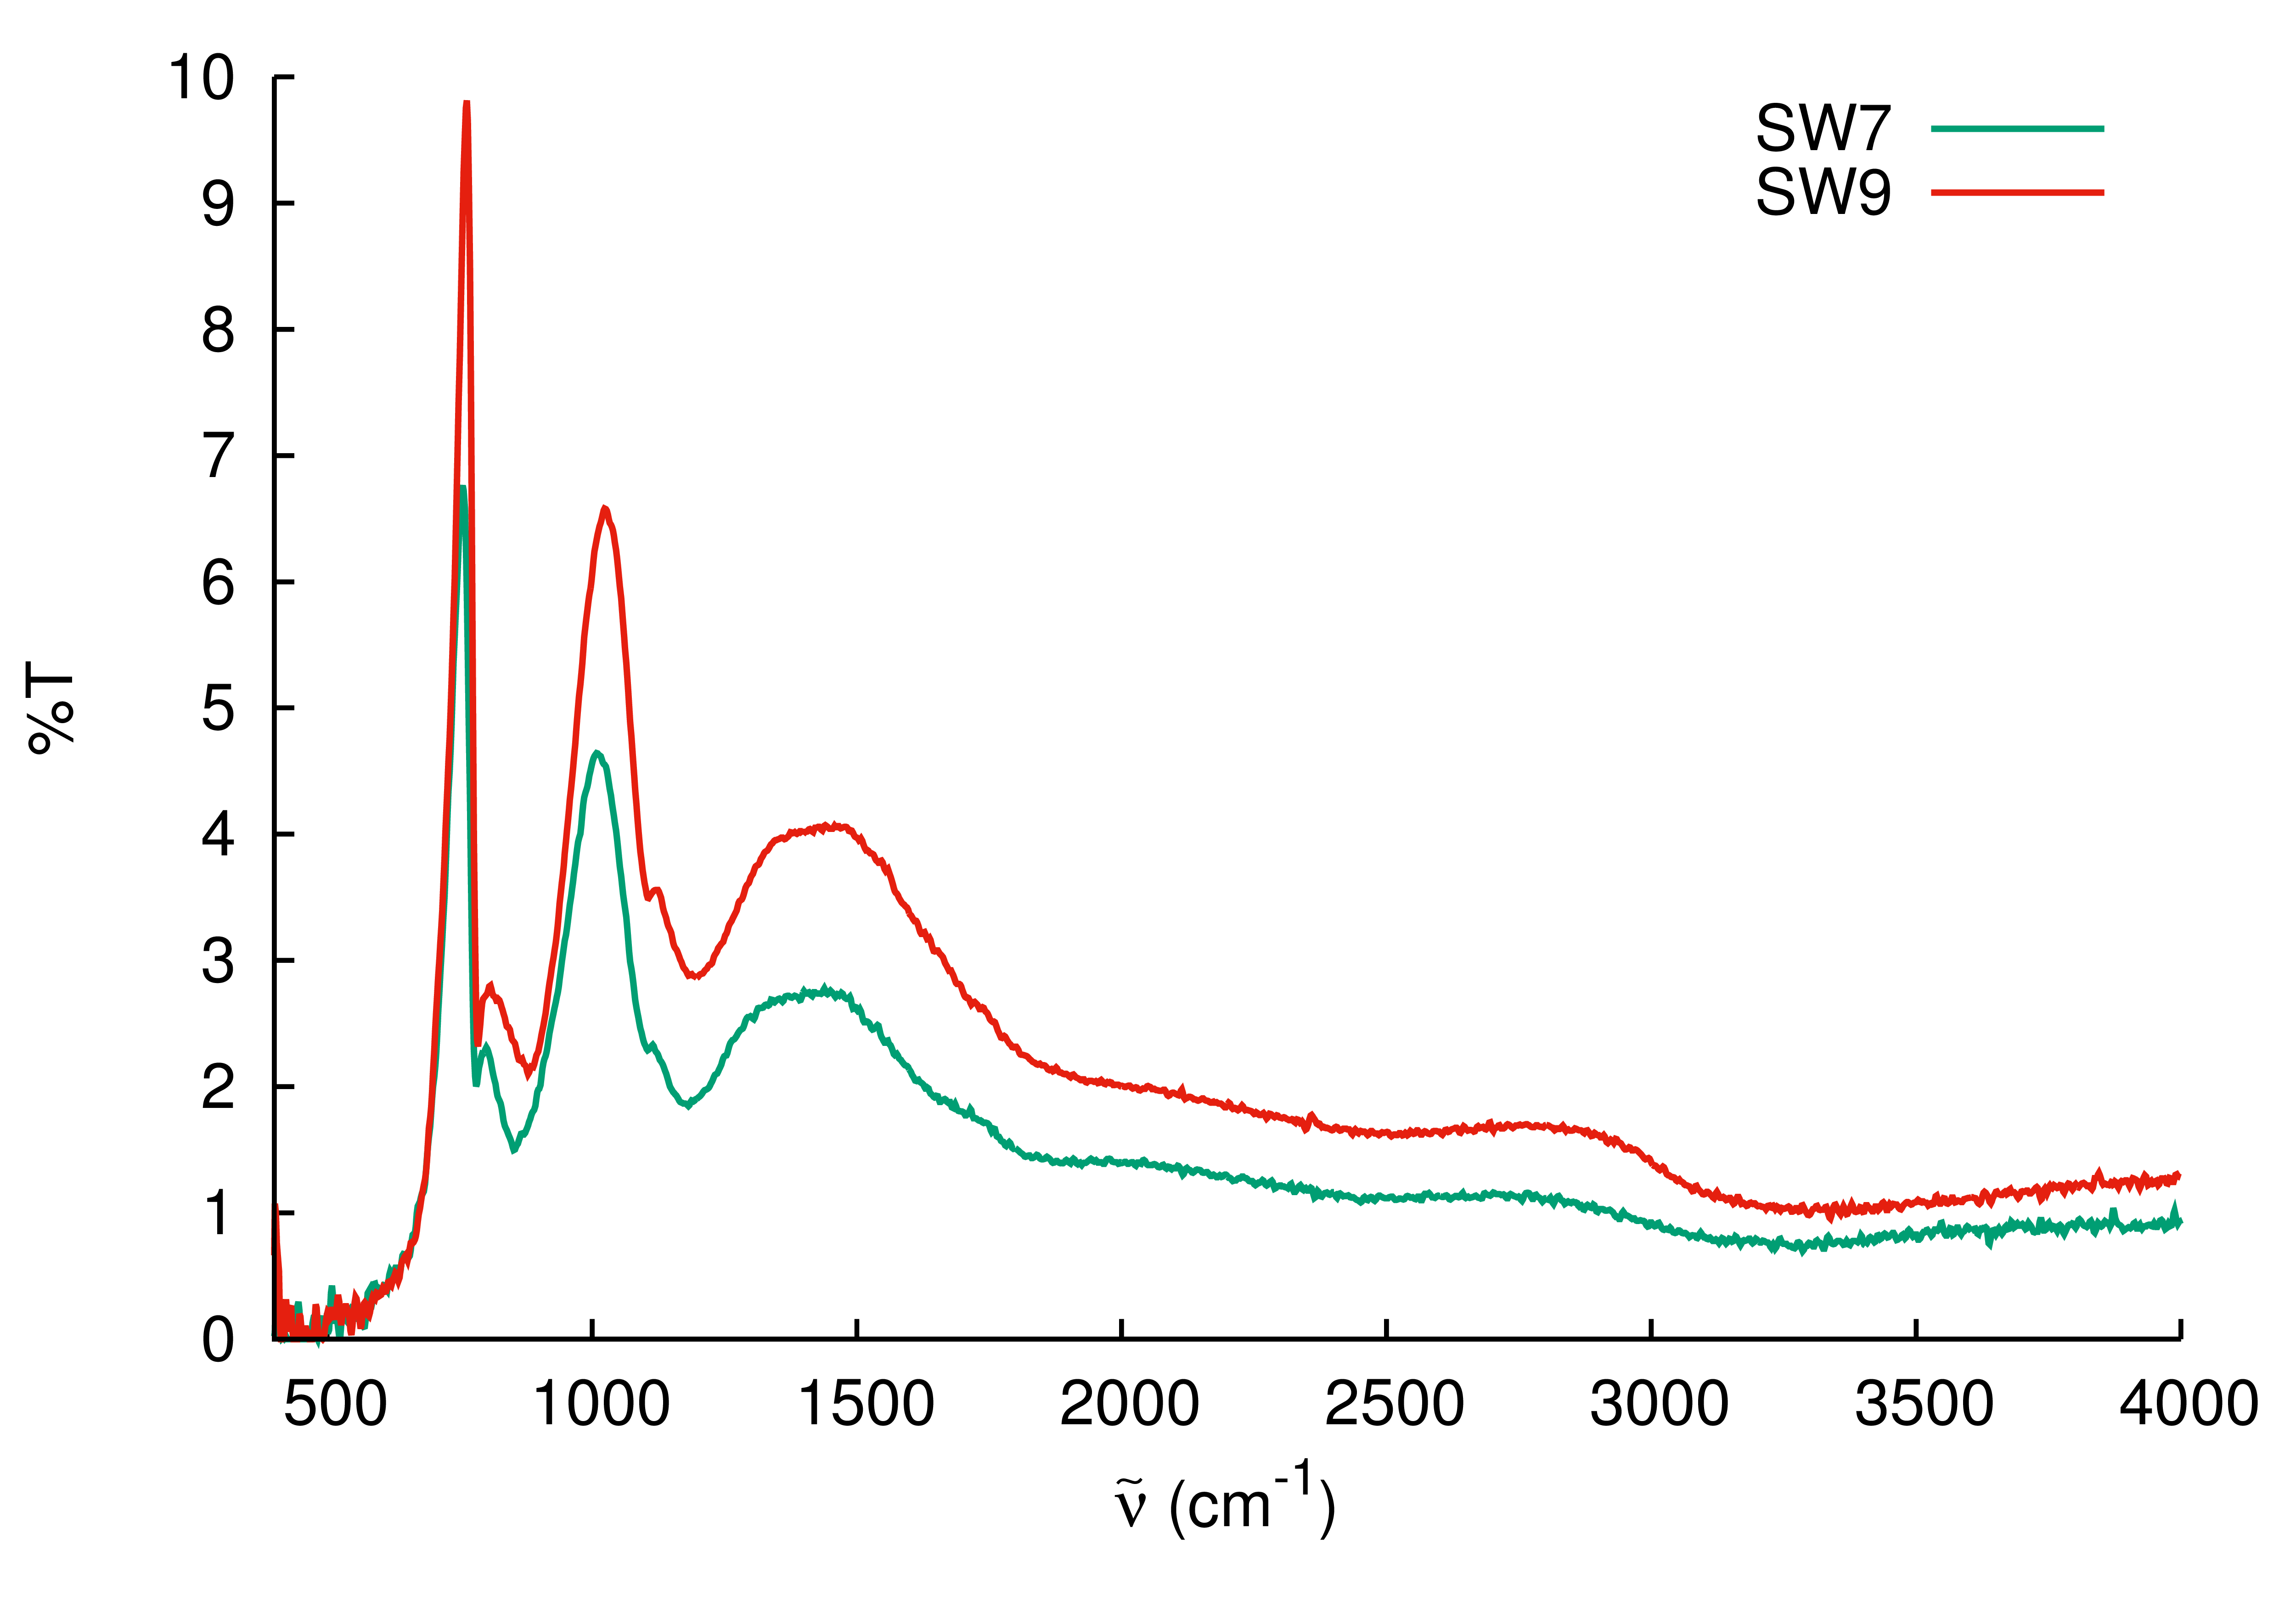
Comparison of Mesh with New Timer
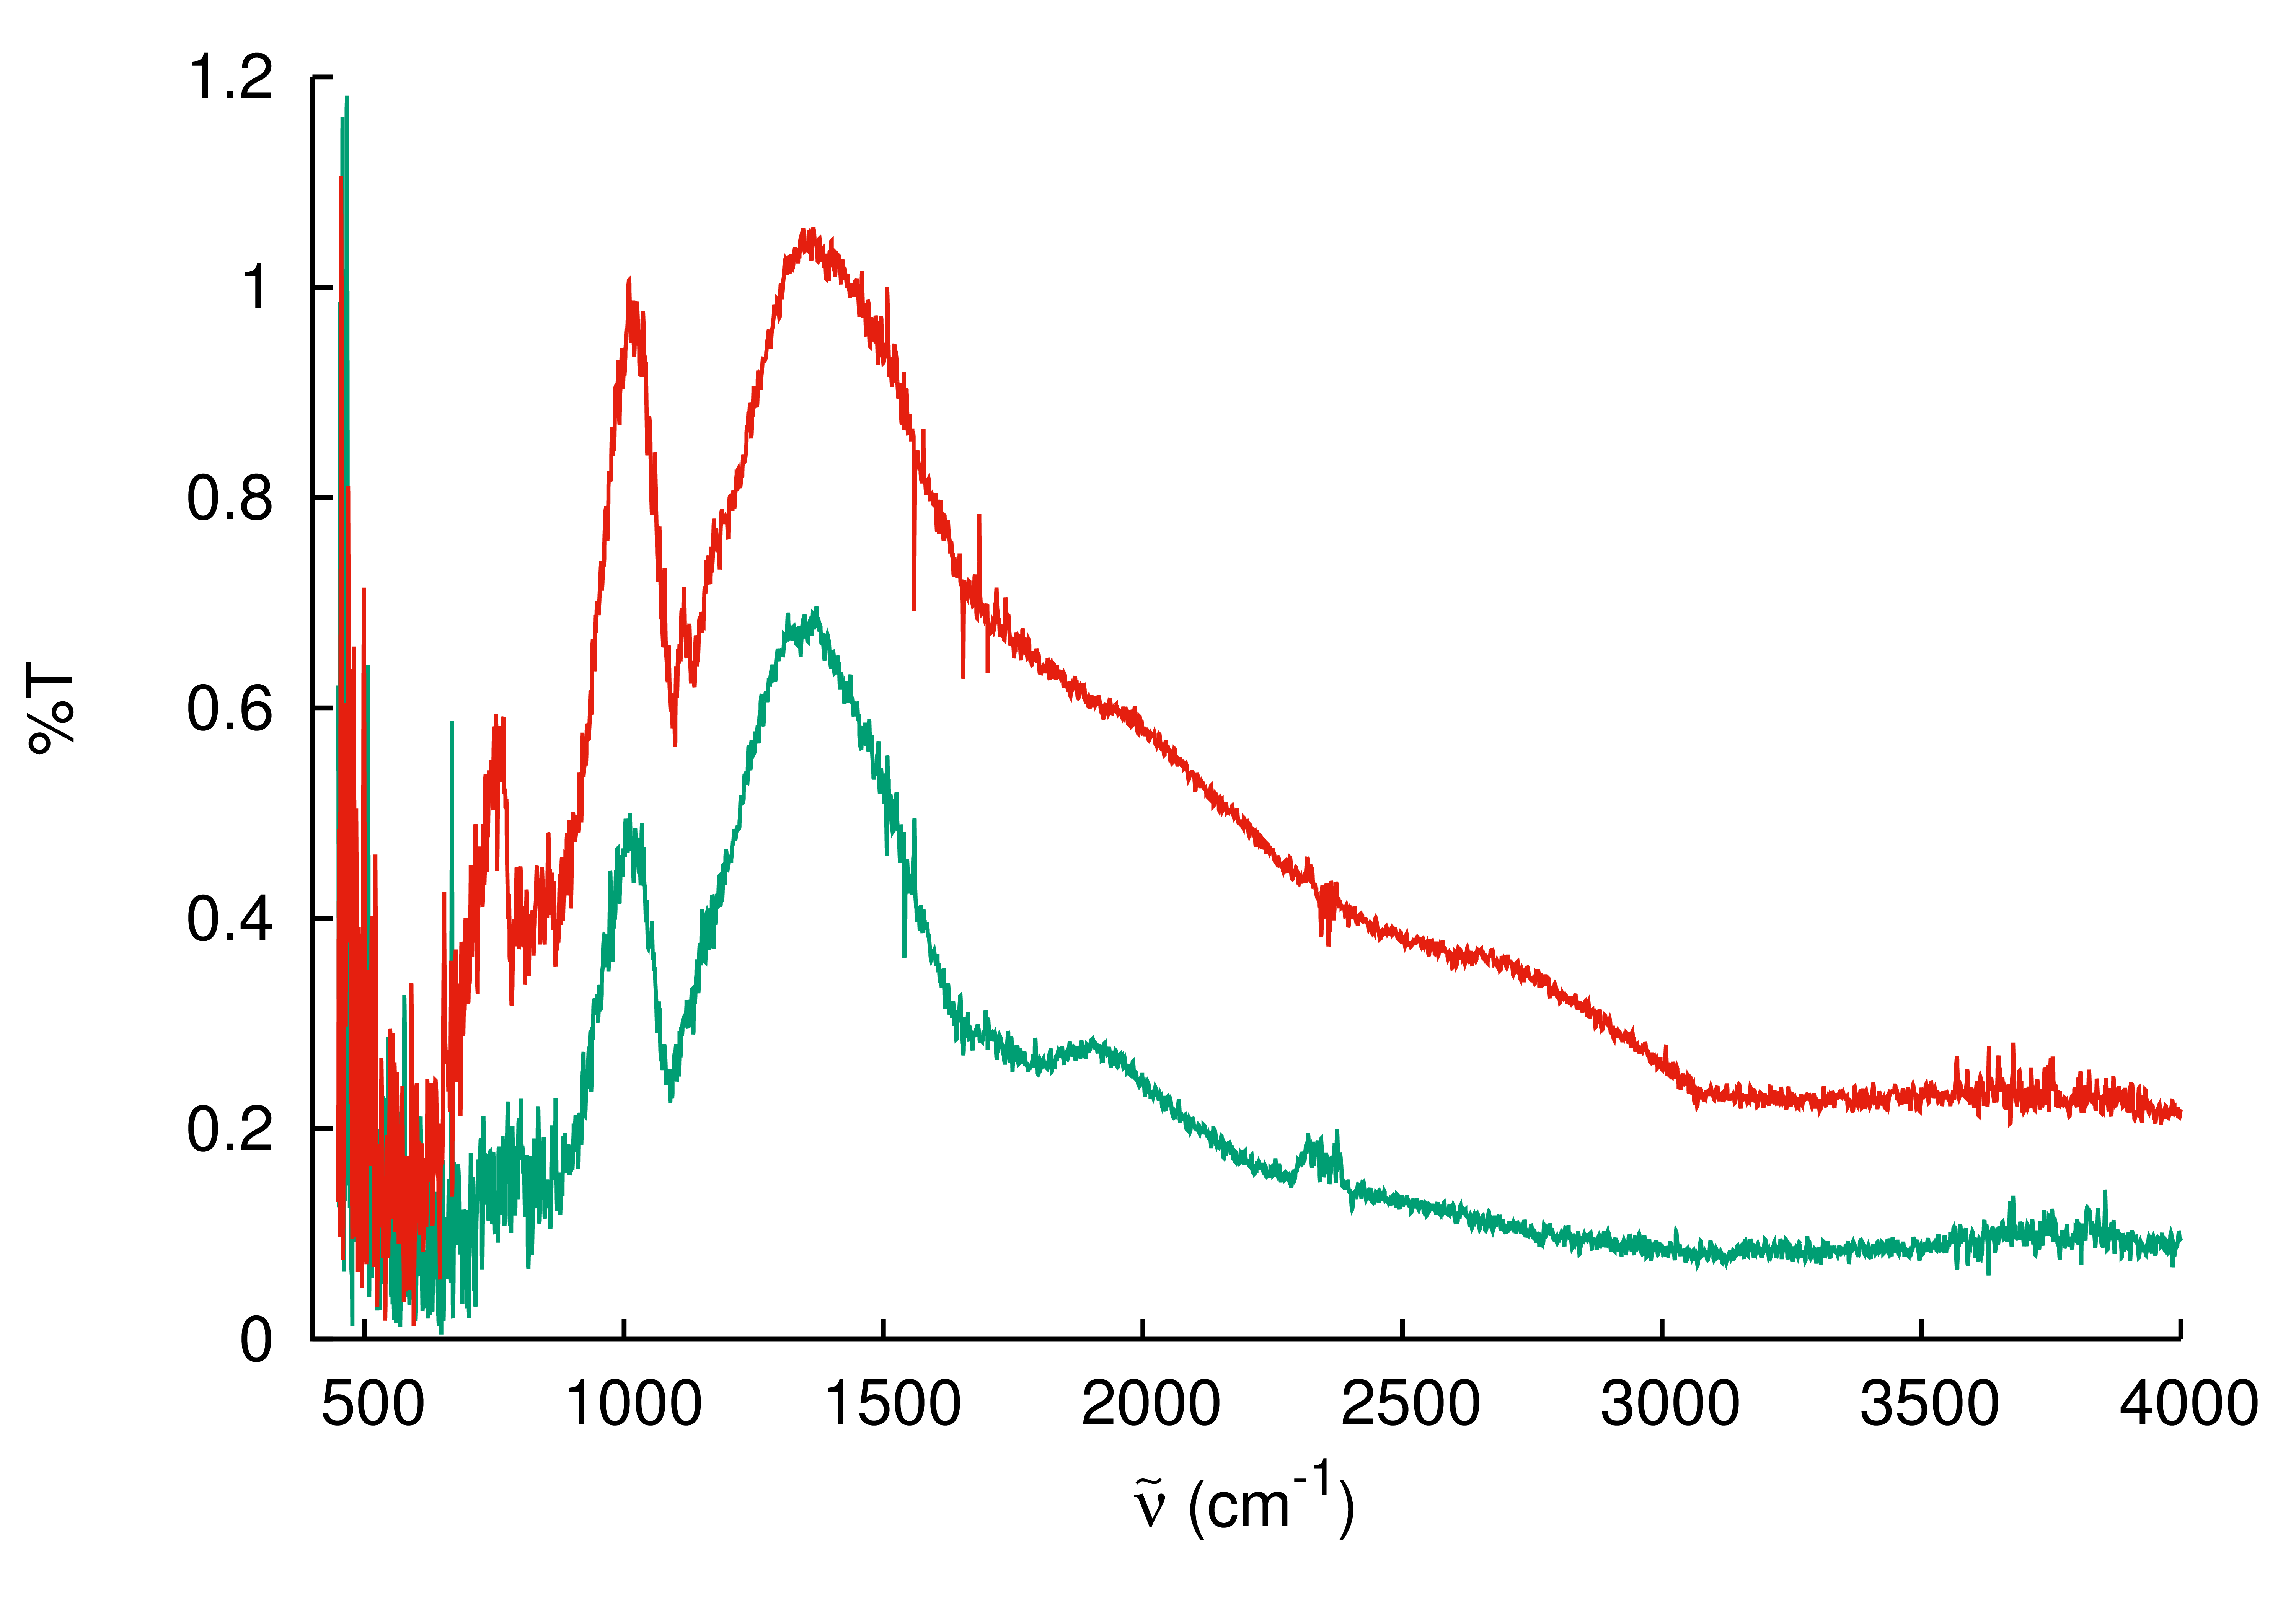
- Both deposited for 6 seconds (6000 ms)
- How can this difference be explained?
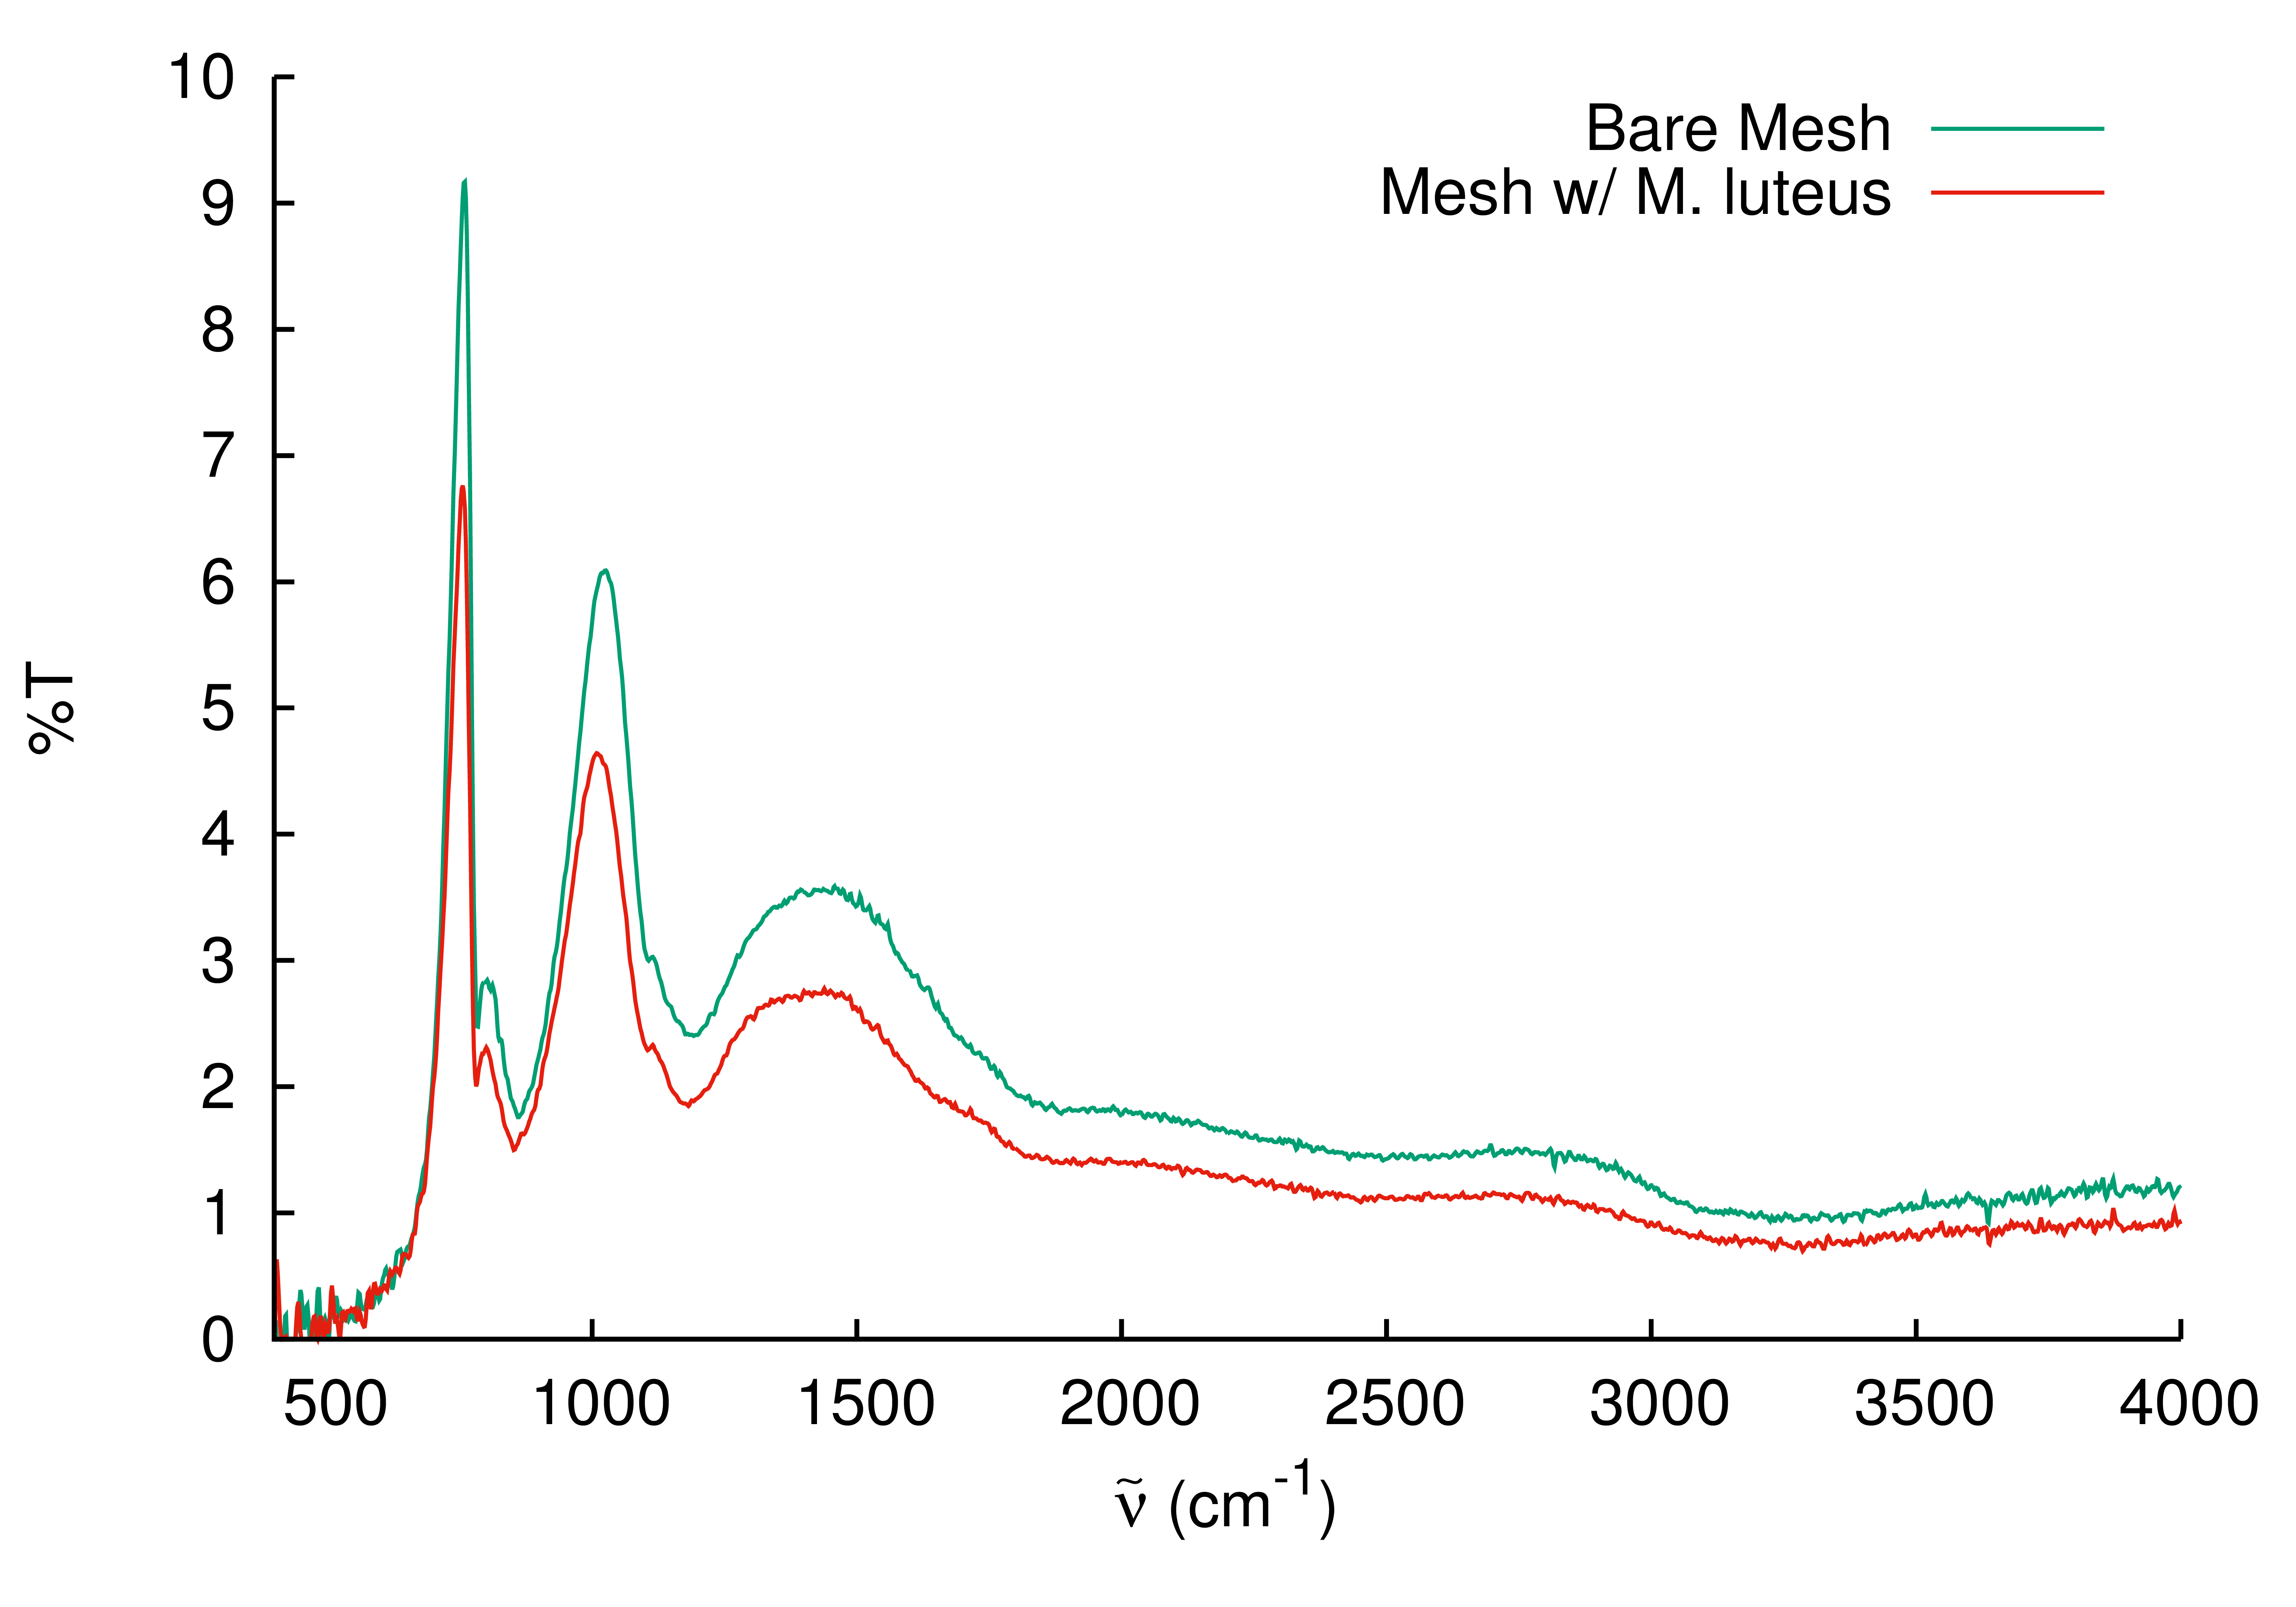
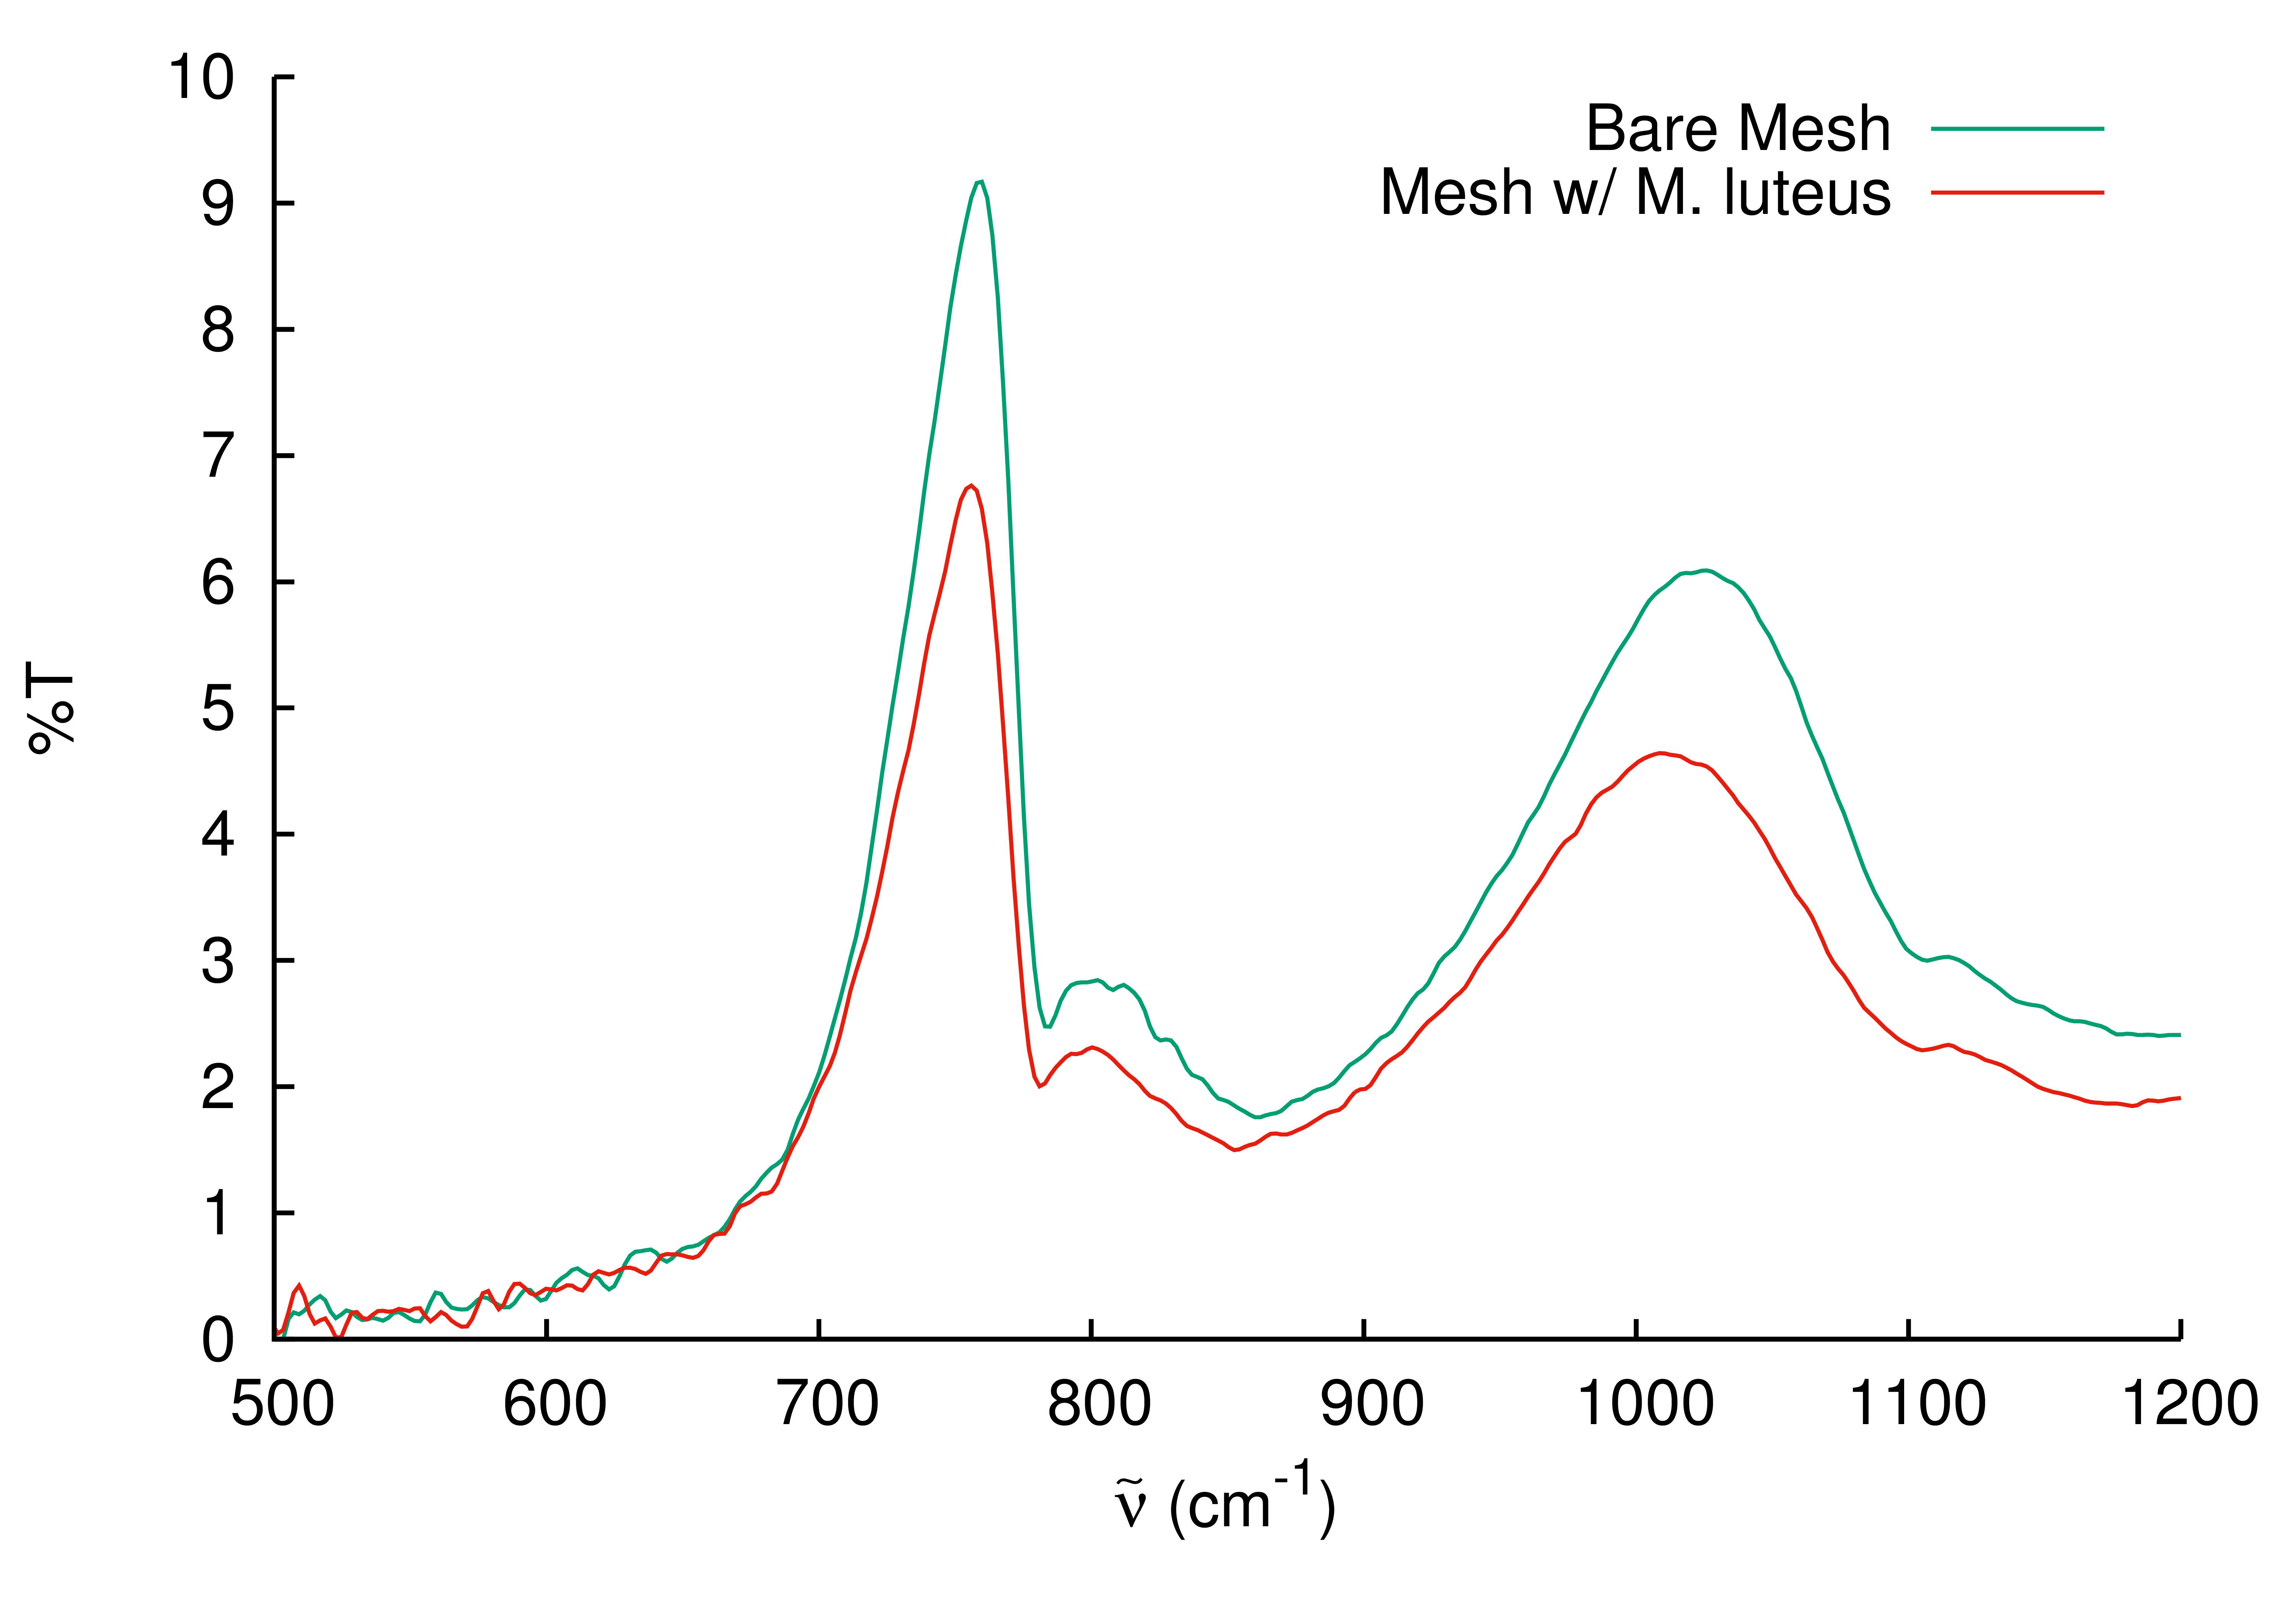
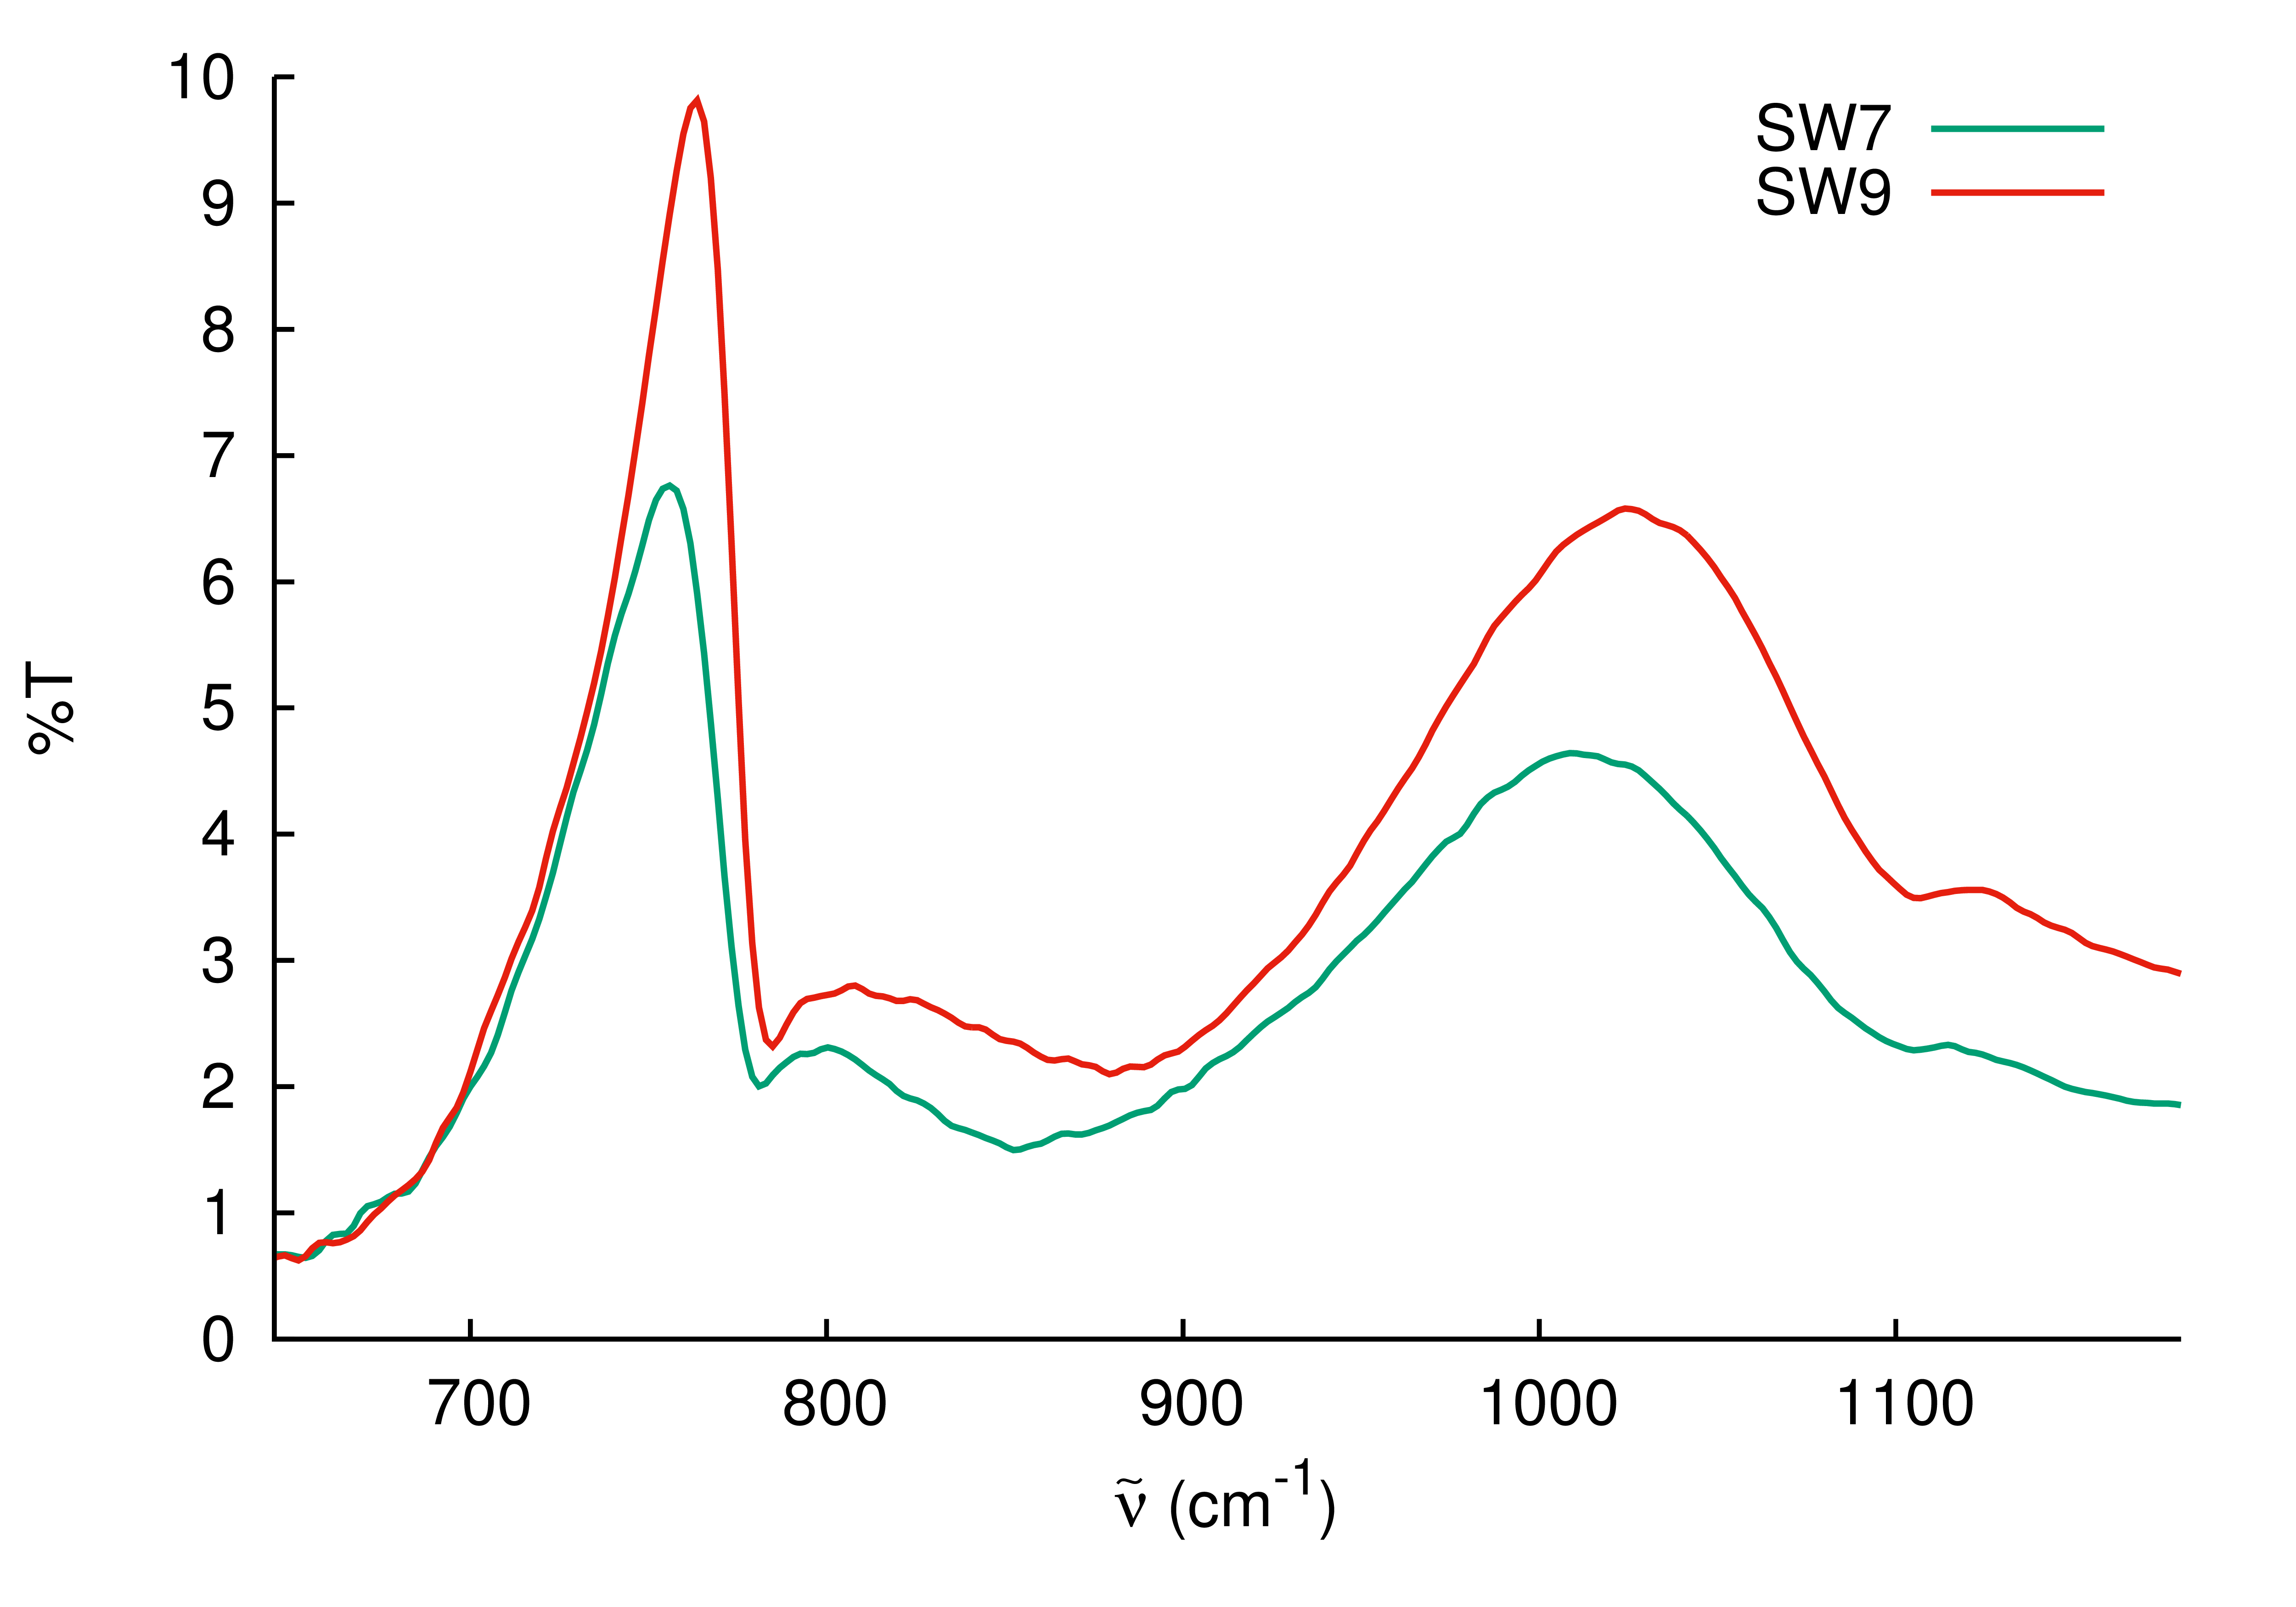
How Big is this Difference
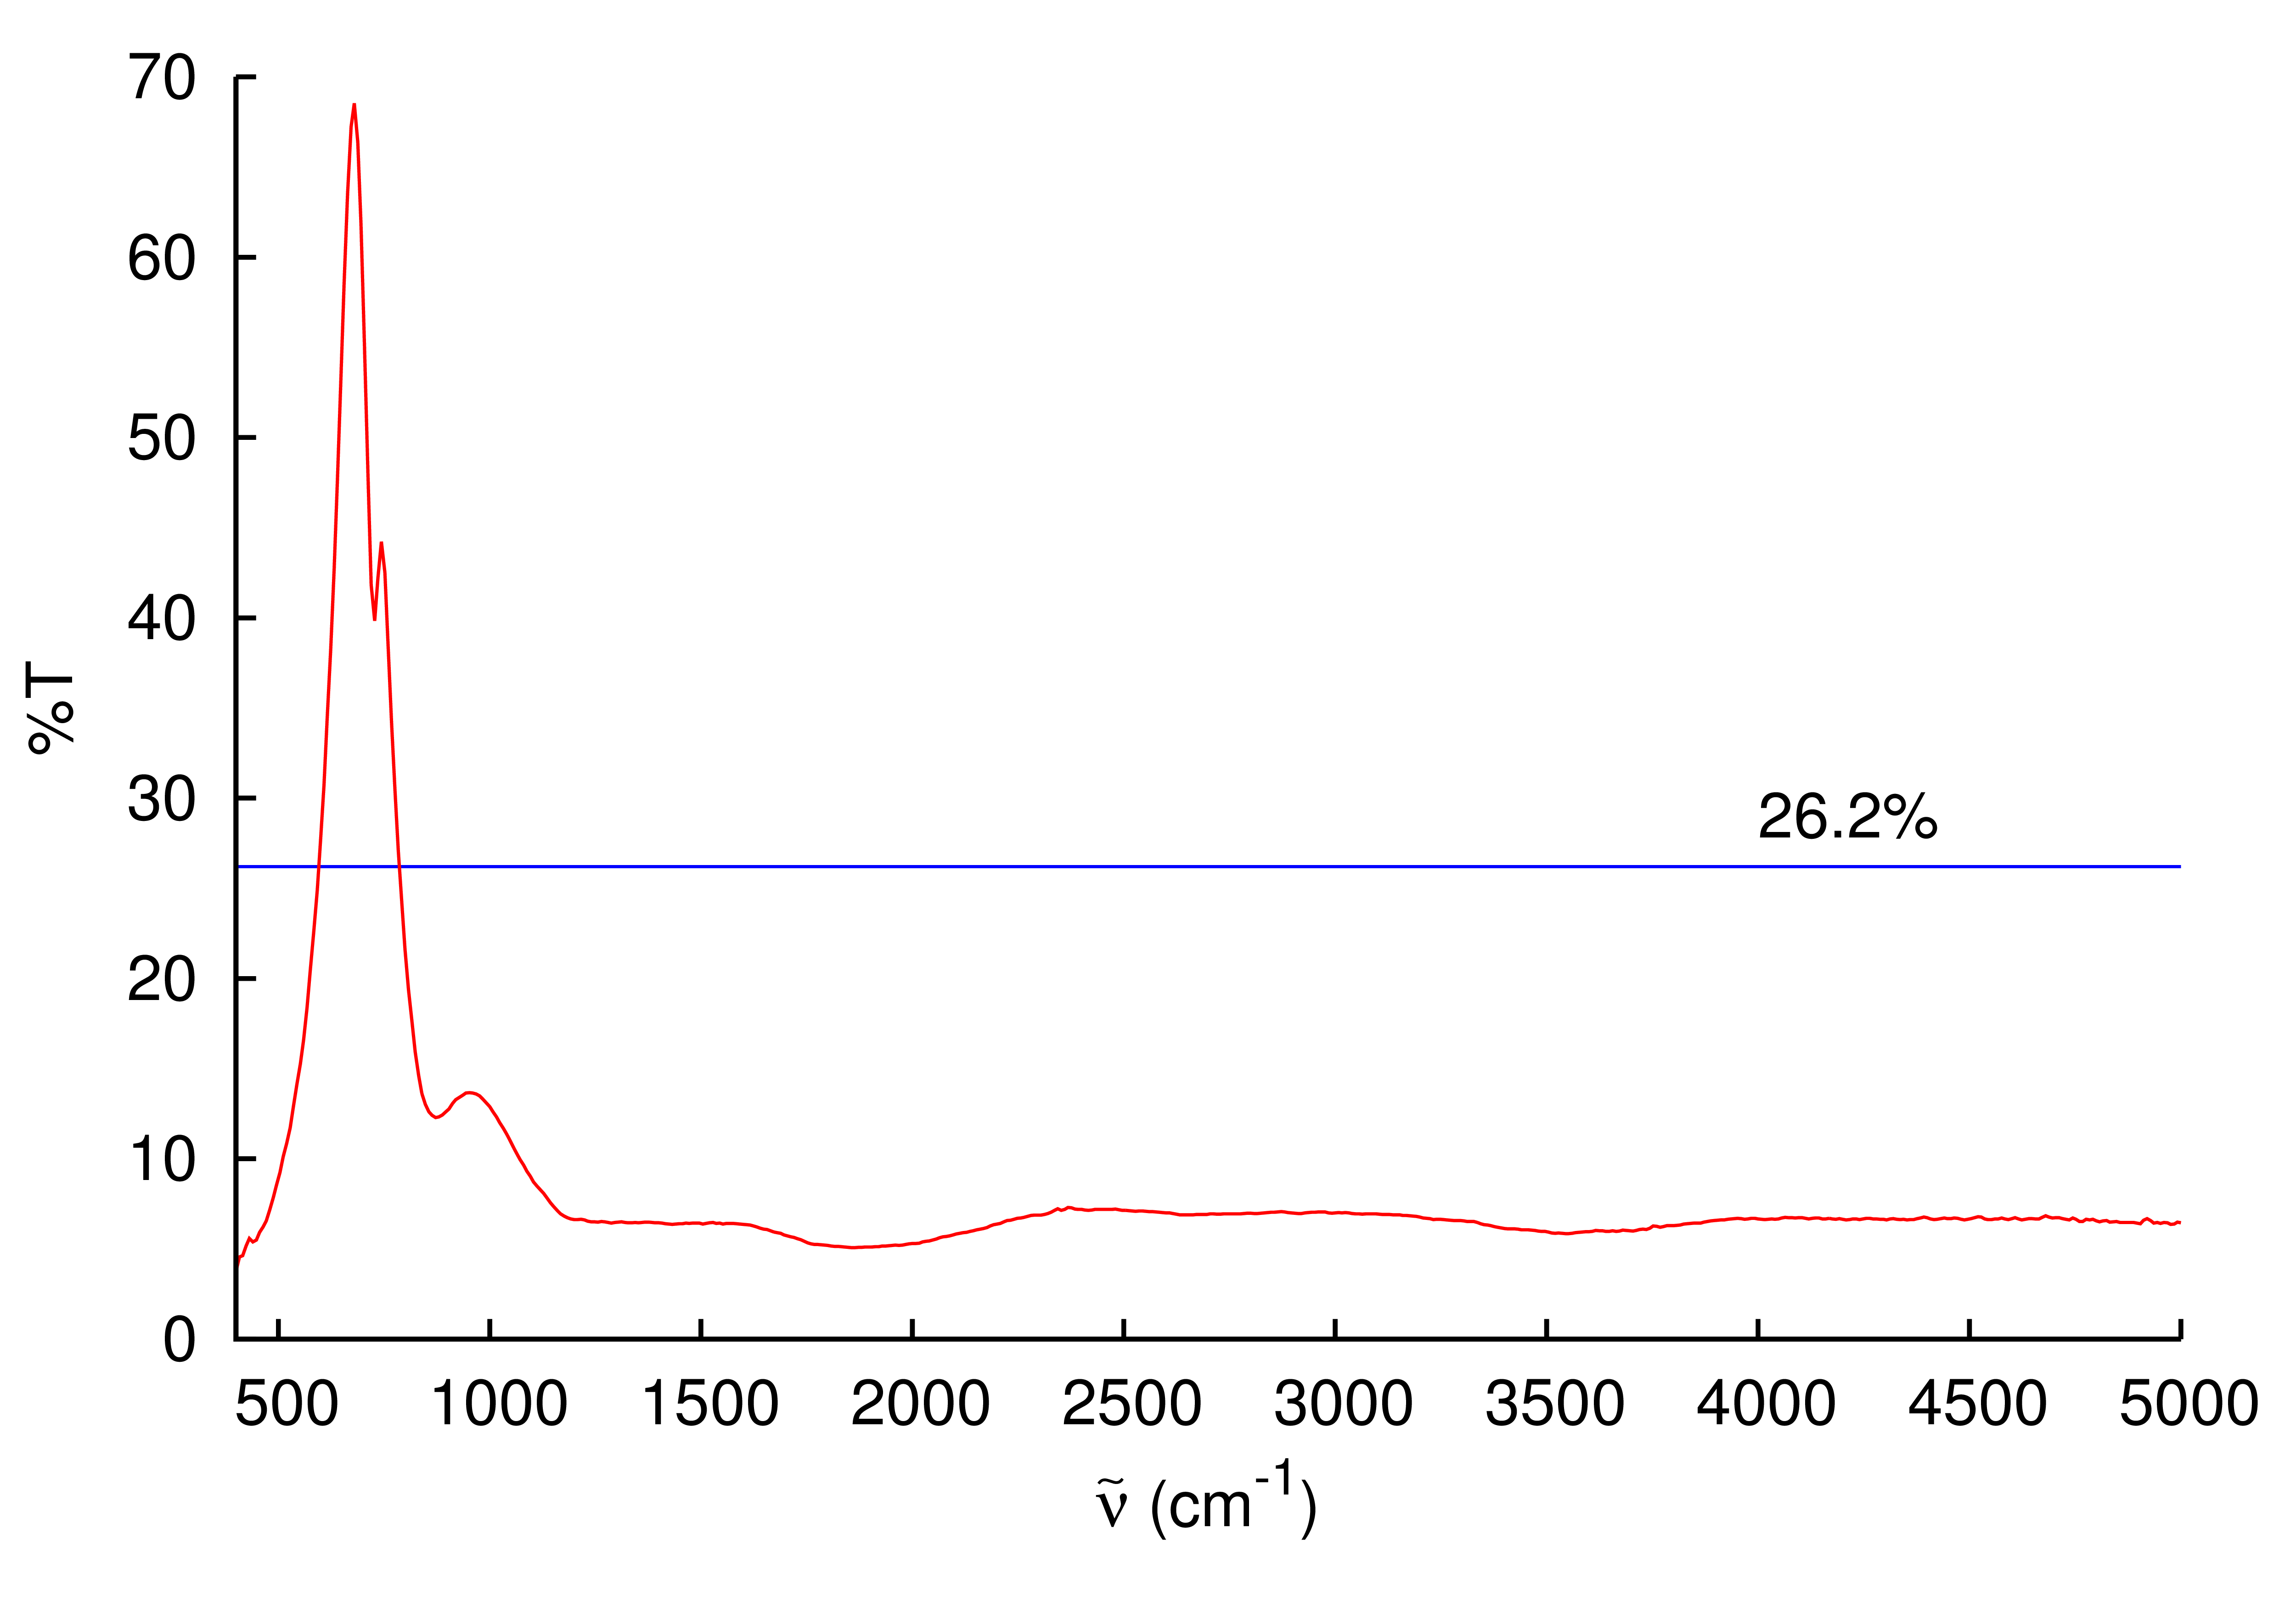
Explanation of the Differences
- The distance between the anode (the mesh) and the cathode is approximately \(0.102\,\mathrm{in}=2.59\,\mathrm{mm}\) during deposition and the potential difference between the two is \(10.0\,\mathrm{V}\).
- This yields an electric field strength between the anode and cathode of \(3860\,\bfrac{\mathrm{V}}{\mathrm{m}}\) or \(3.86\,\bfrac{\mathrm{kV}}{\mathrm{m}}\).
- Hypothesis: Larger surface area means that the maximum electric field strength is in a larger volume of the solution. Therefore, more deposition.
First Bacteria Run with Mesh Created with New Timer
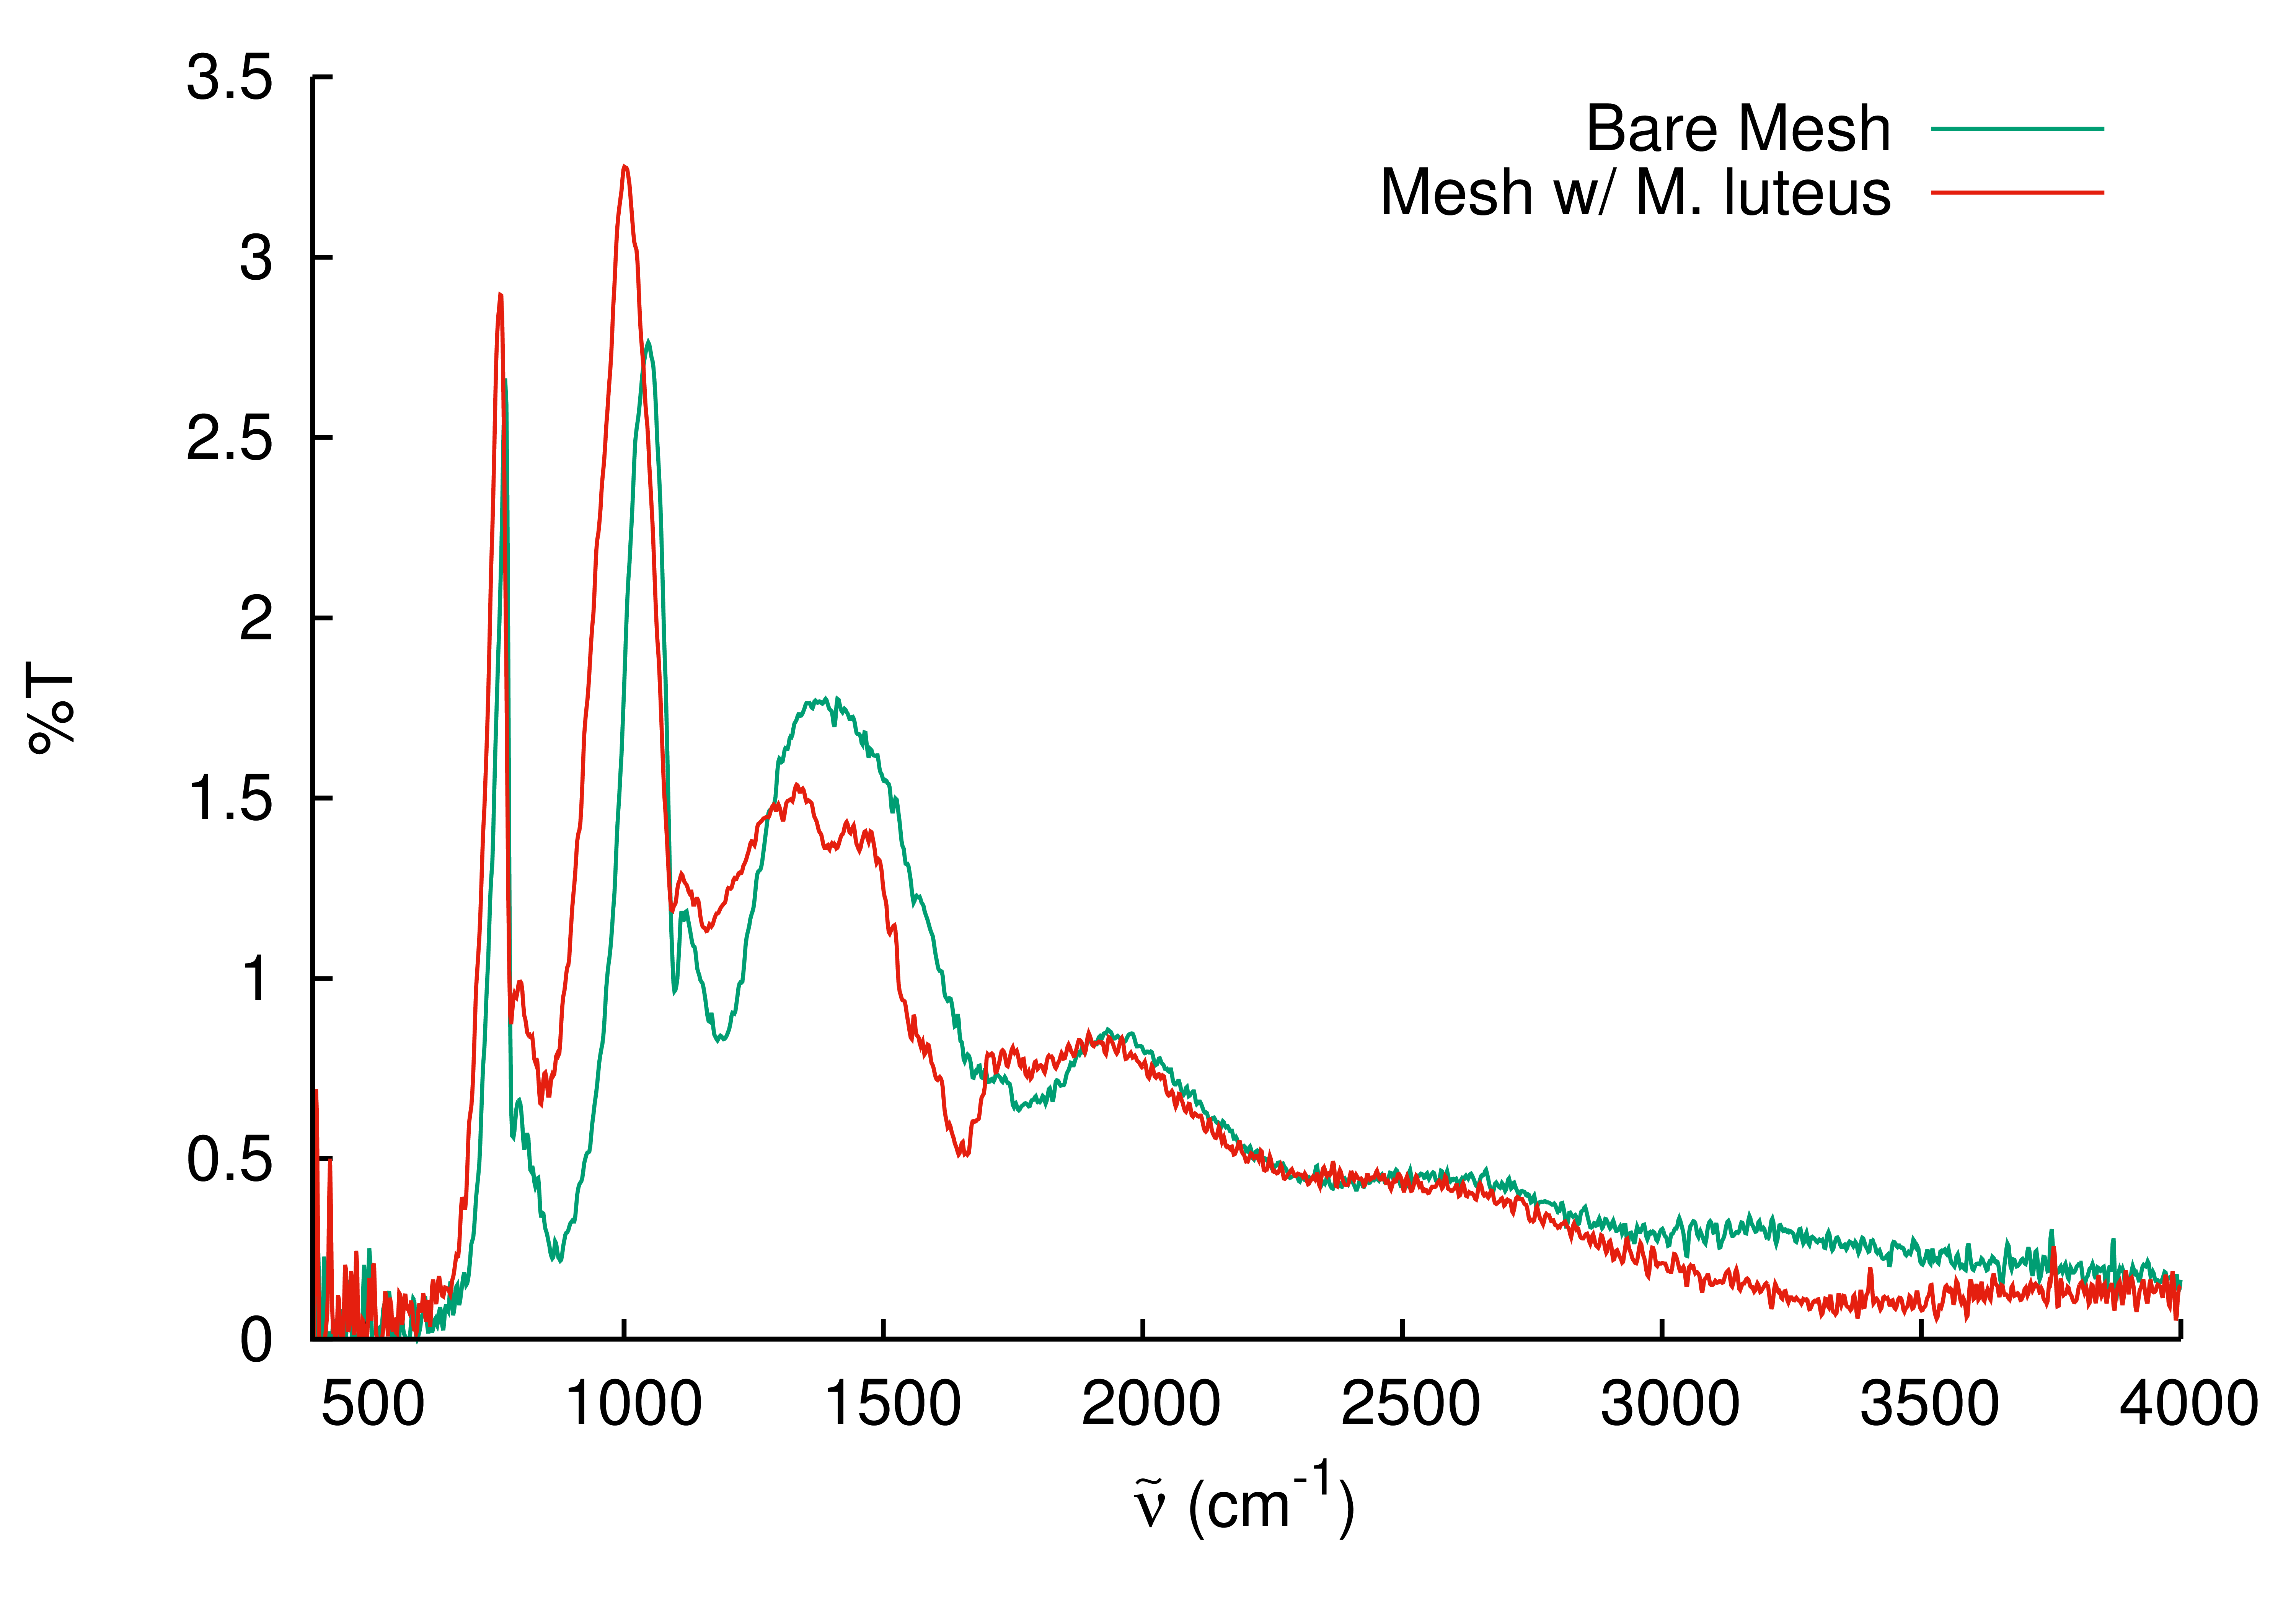
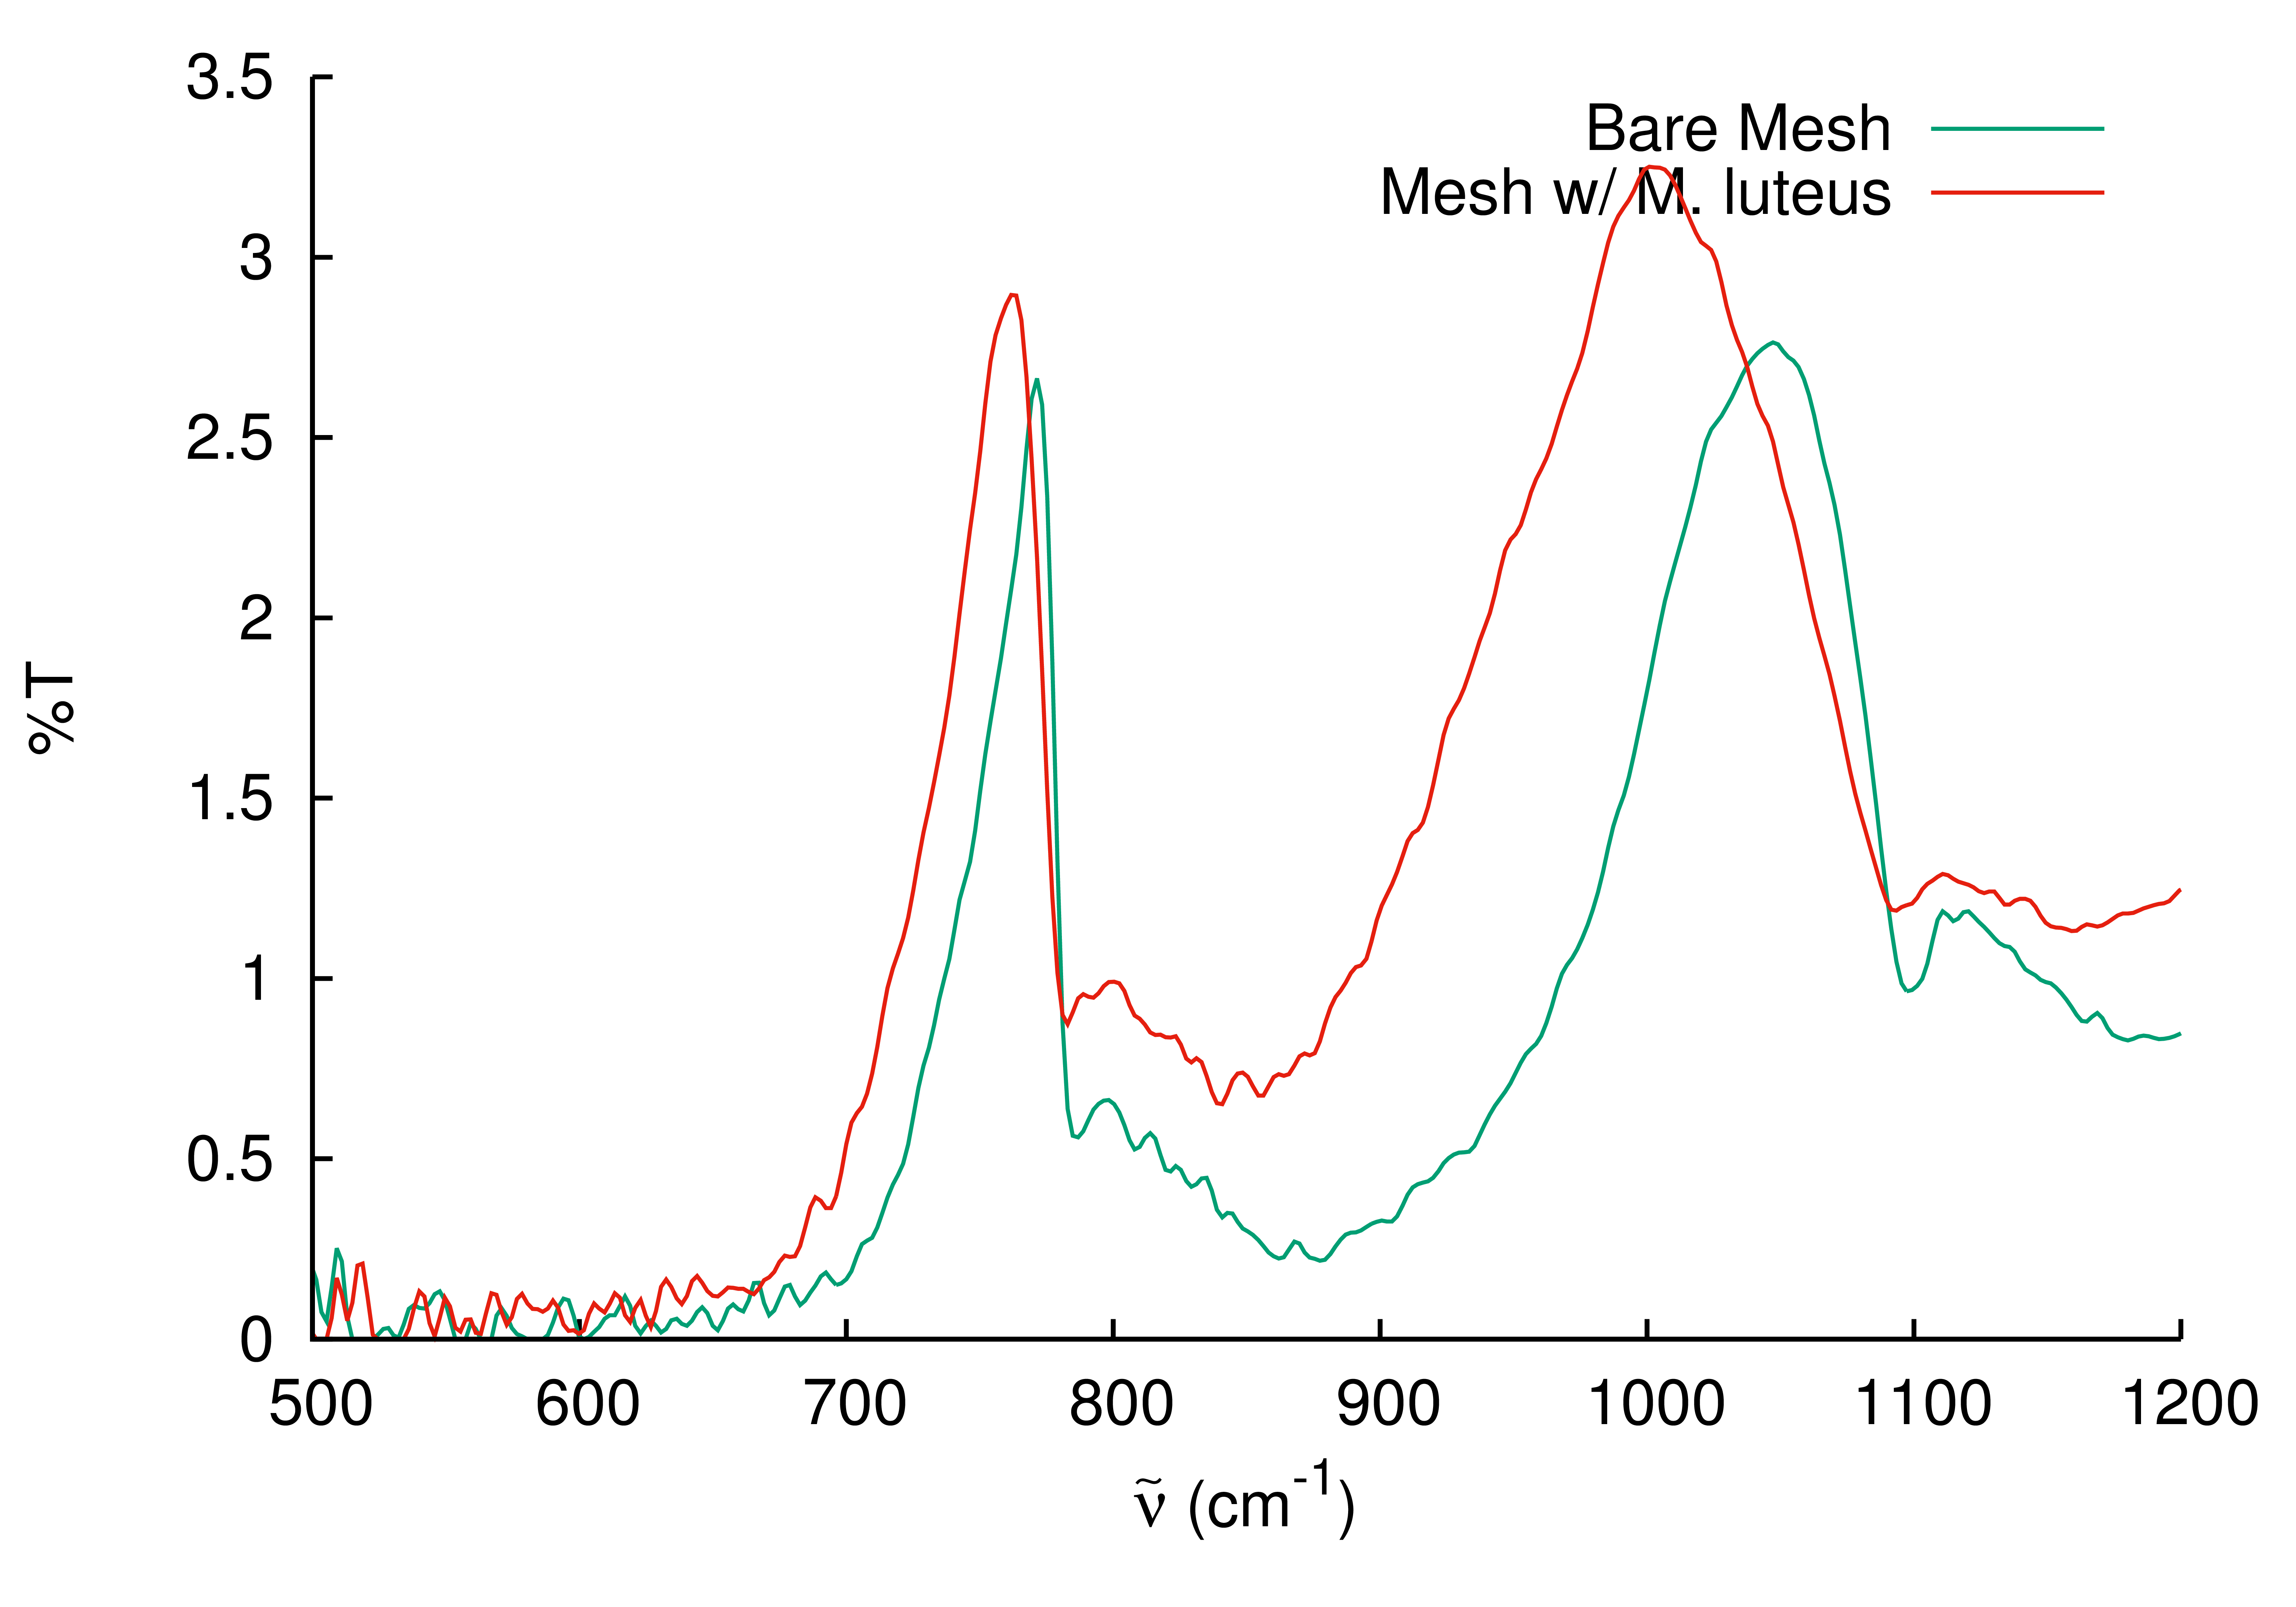
Spectrum of Micrococcus luteus
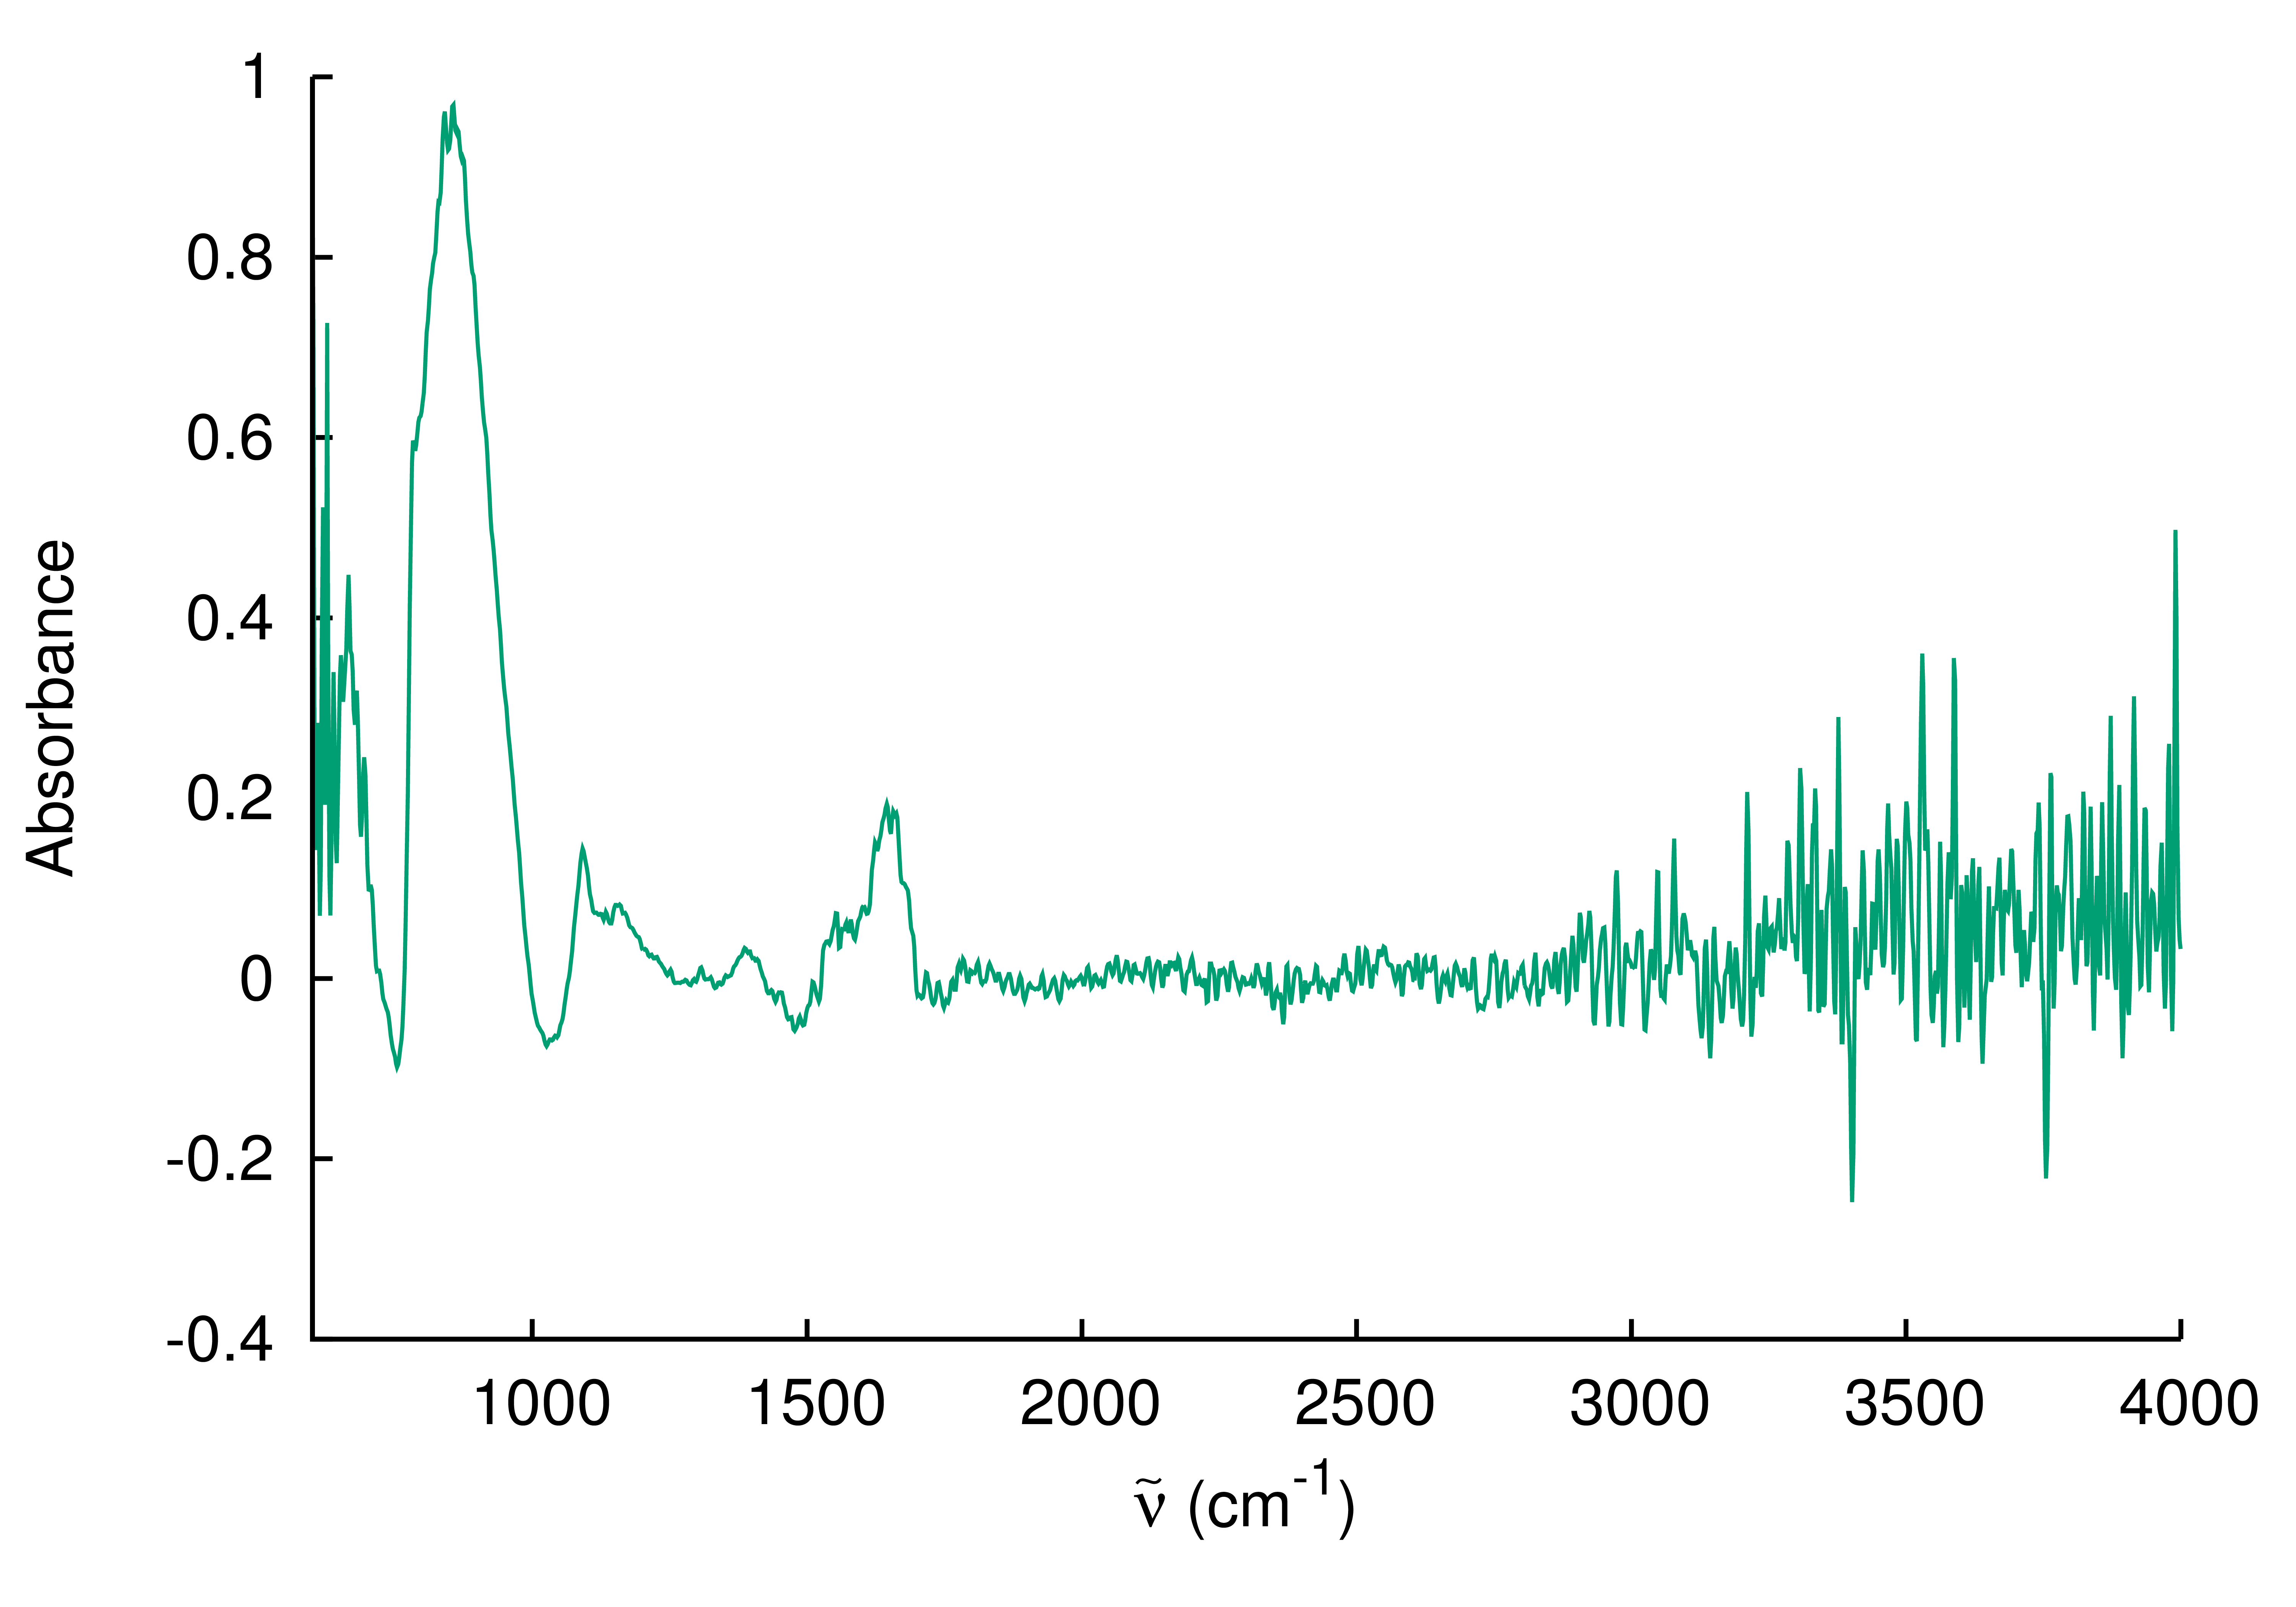
- A program was written that allows for the automated removal of the background spectrum
- The program eliminated the need to extract the background point-by-point, spectrum-by-spectrum.
/