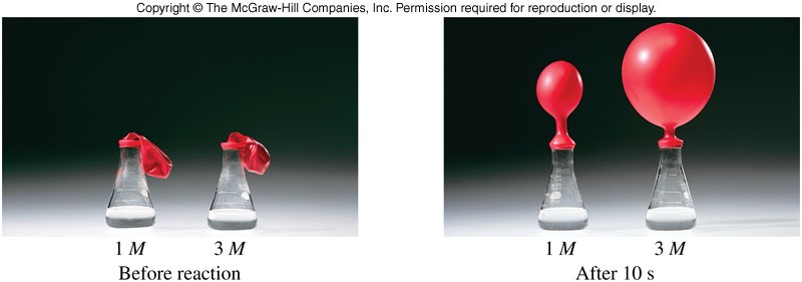
Example of Reaction Rates
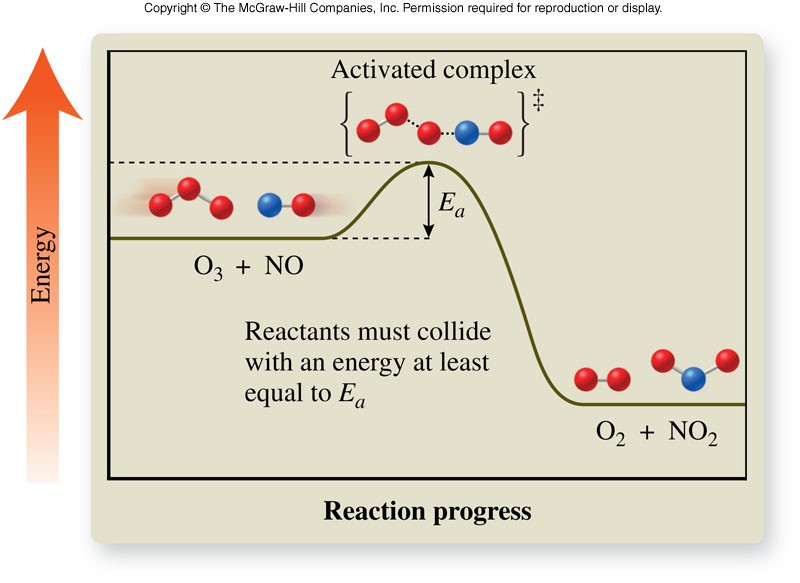
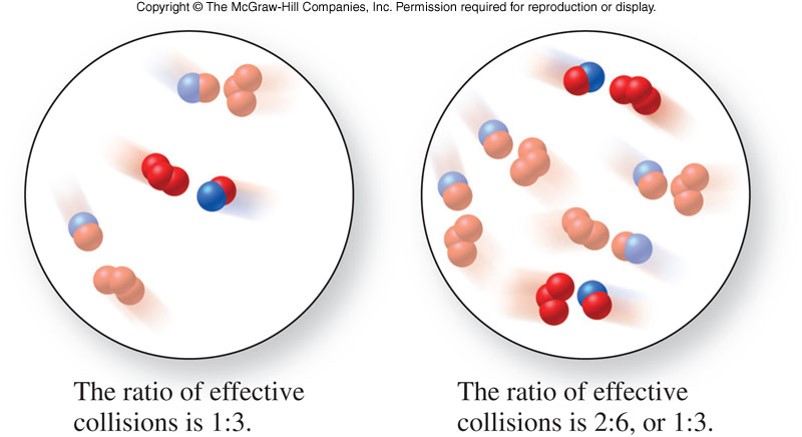
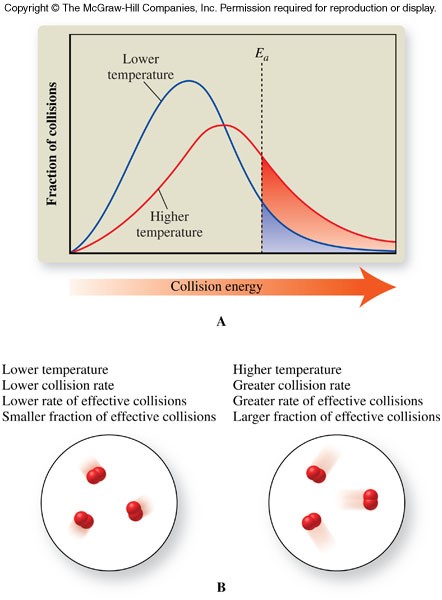
Collision Theory

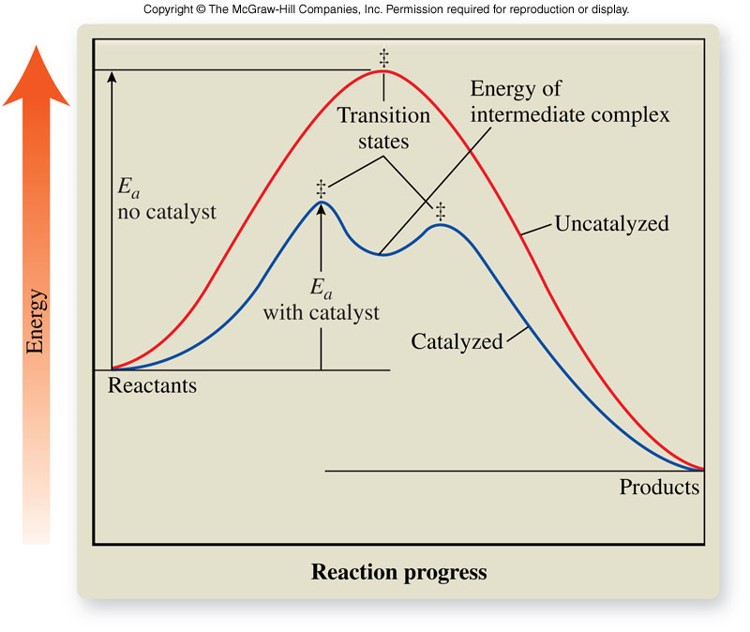
Energy Diagrams
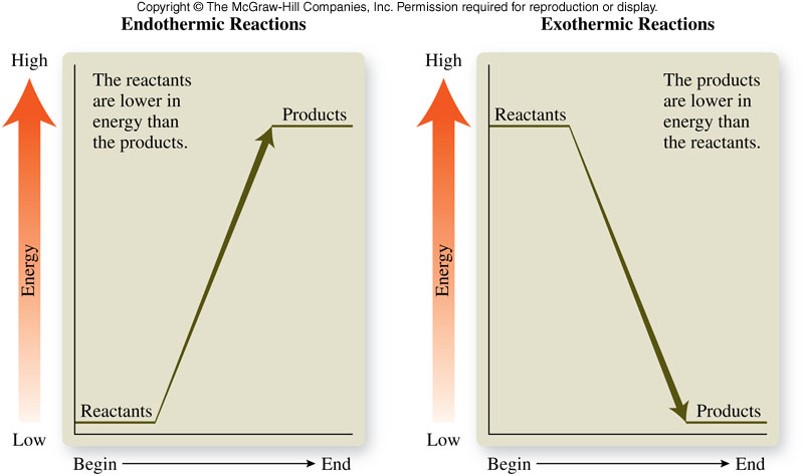
Energy Diagram for a Reaction
Concentration and Reaction Rates
Temperature and Collision Theory
Catalysis
Enzymes
- Molecules that catalyze specific reactions within living organisms
- Most enzymes are large protein molecules with molar masses between 12,000 and 40,000 g/mol
- Enzymes contain depressions, or holes, called active sites
- The shape of an active site is unique to only one specific kind of reactant molecule, called a substrate
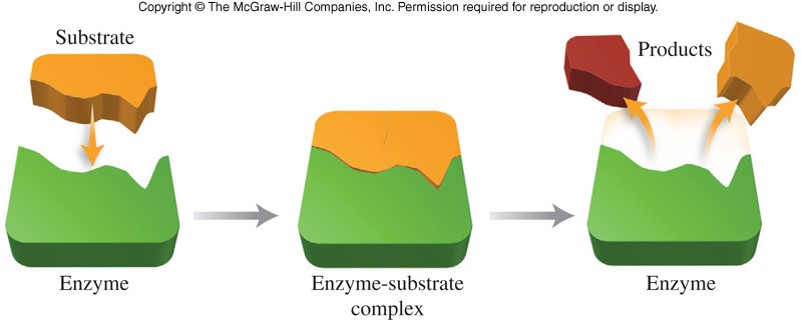
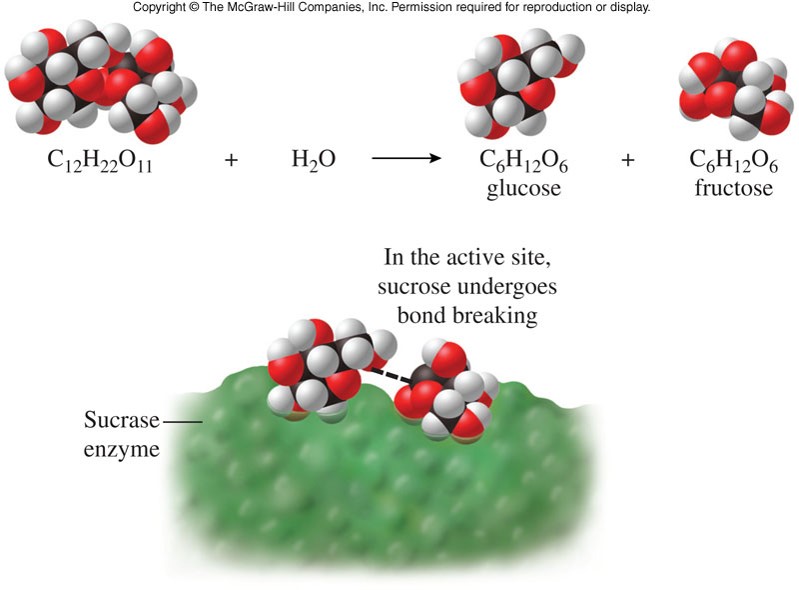
Enzyme Catalysis
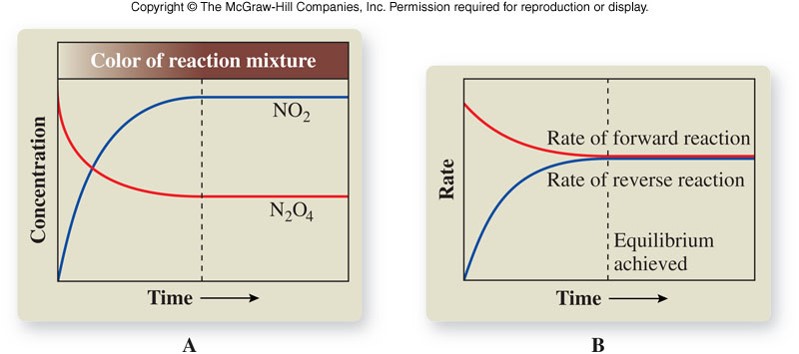
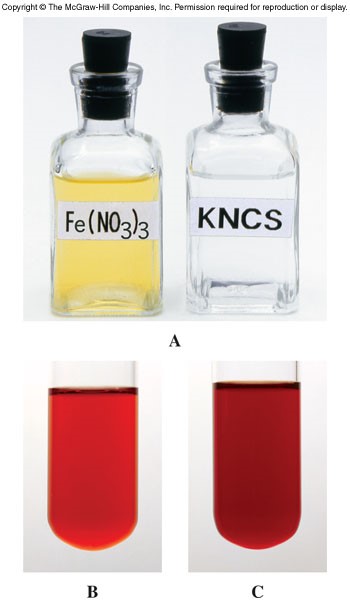
Observing a Chemical Equilibrium
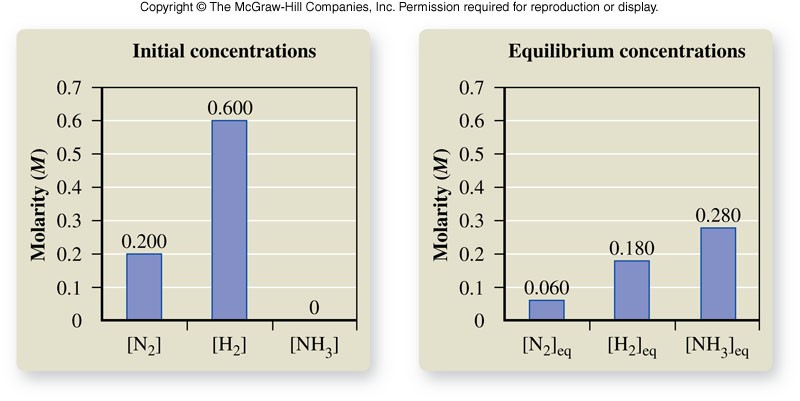
Equilibrium Constant
- The value of the equilibrium constant tells us about the position of equilibrium.
- When the value is much greater than 1, there are more products than reactants at equilibrium.
- When the value is less than 1, there are more reactants than products at equilibrium.
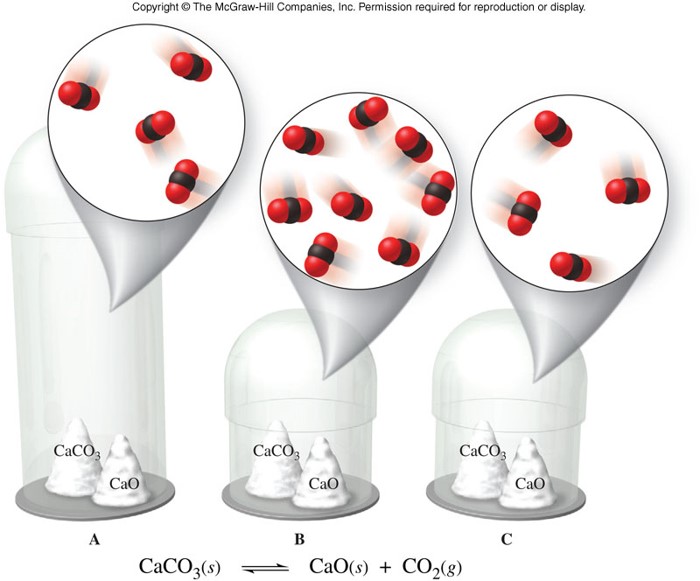
Heterogeneous Equilibrium (cont.)
- Consider the reaction: \[ \chem{Br_2(l) \rightleftharpoons Br_2(g)} \]
Changes in Concentration
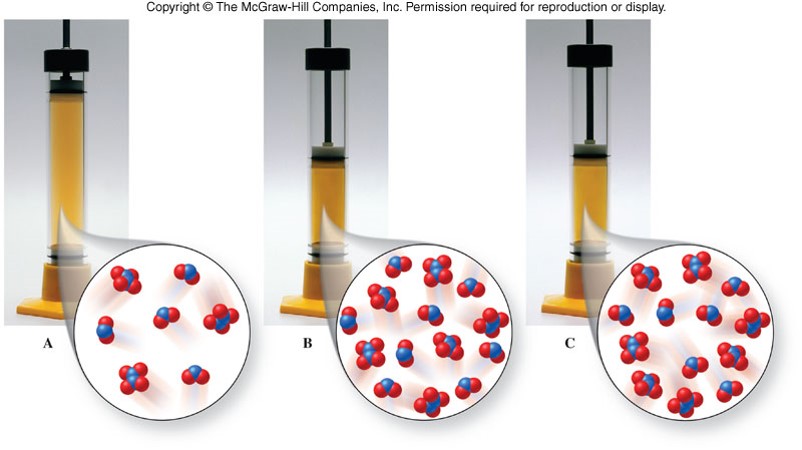
Changes in Volume
- Because gases expand to fill a container, changes in volume affect the concentrations of any gases in the reaction container.
Example of Changes in Volume
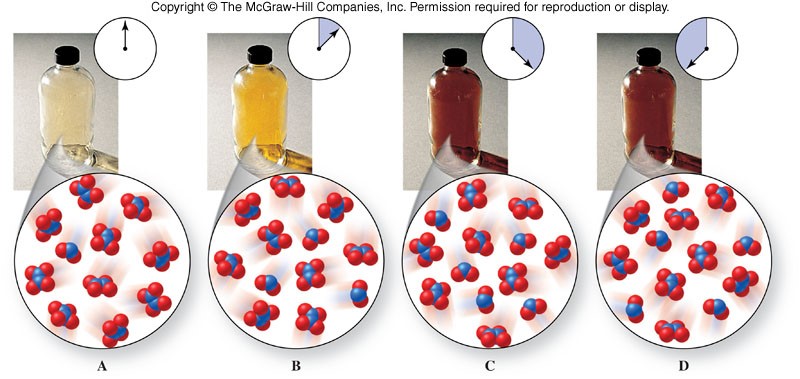
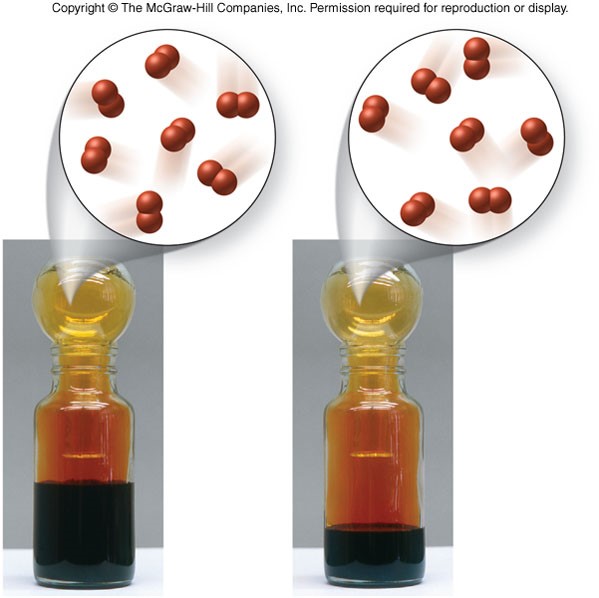
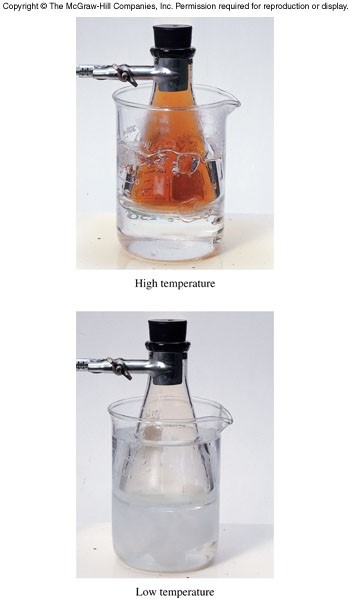
Example of Changes in Temperature
\[ \chem{heat + N_2O_4(g) \rightleftharpoons 2NO_2(g)} \]
/