Chapter 1
Matter and Energy
Shaun Williams, PhD
Matter and its Classification
Chemical Classifications of Matter
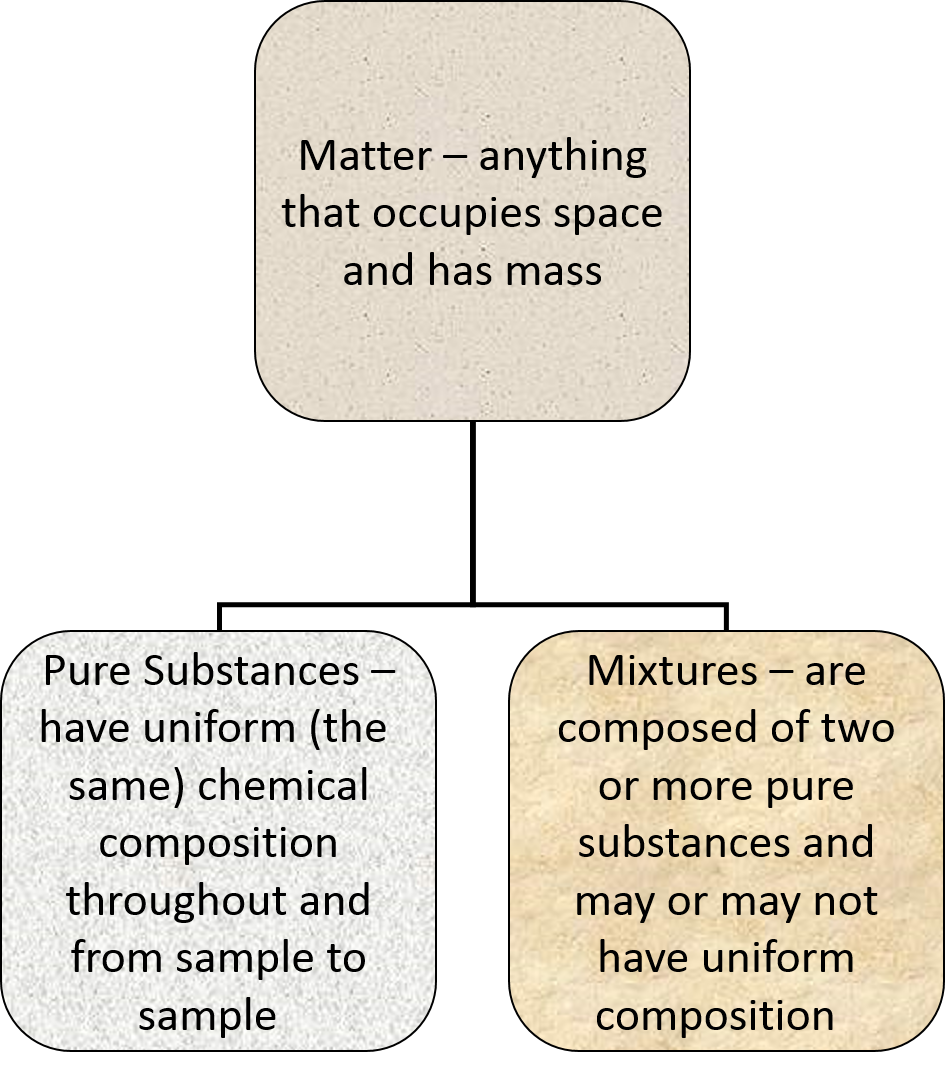
Pure Substances
- Have uniform, or the same, chemical composition throughout and from sample to sample.
- Two kinds of pure substances
- Elements
- An element is a substance that cannot be broken down into simpler substances even by a chemical reaction.
- Elements are separated further into metals and nonmetals.
- Compounds
- A compound is a substance composed of two or more elements combined in definite proportions.
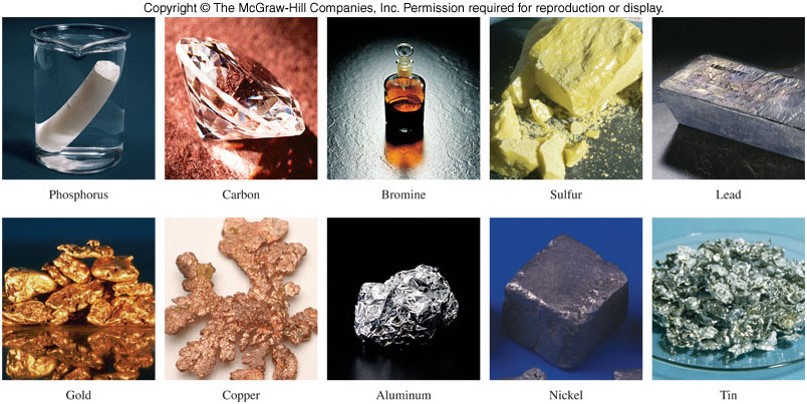
- Elements
Practice - Represntations of Matter
Identify the nonmetals in the following figure. Explain the characteristics you considered in making your decision.
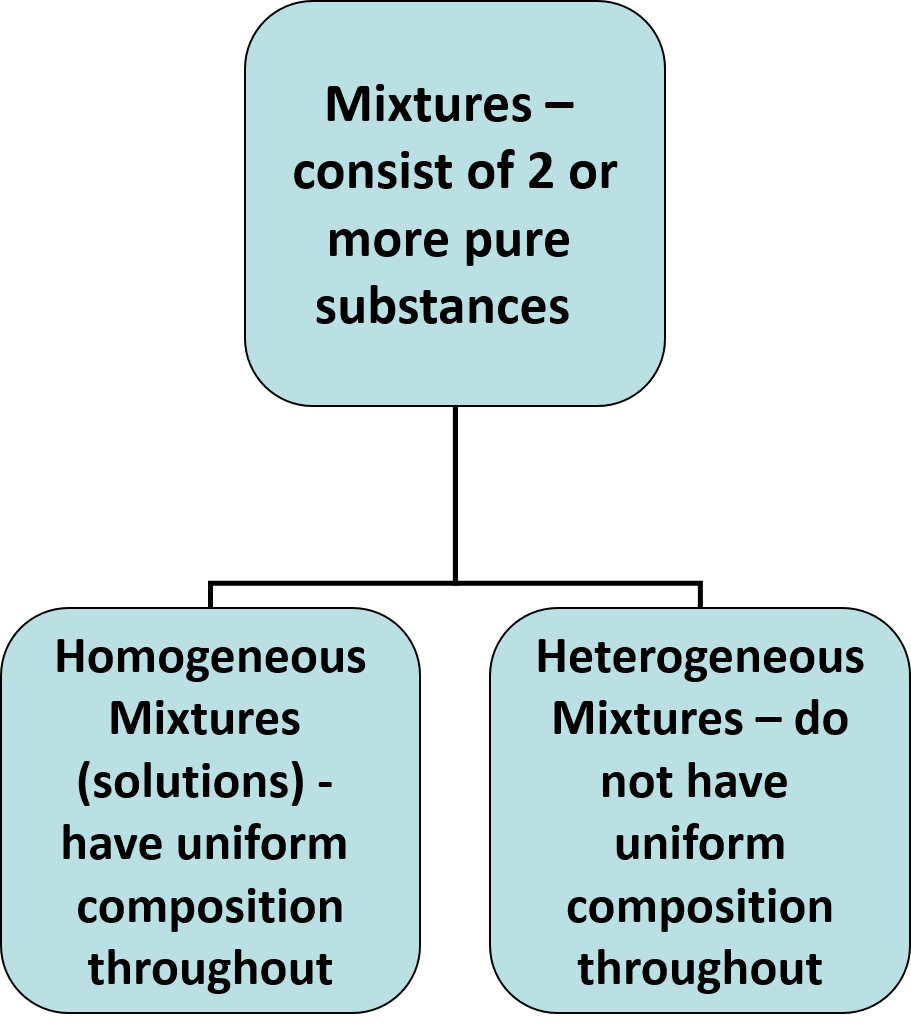
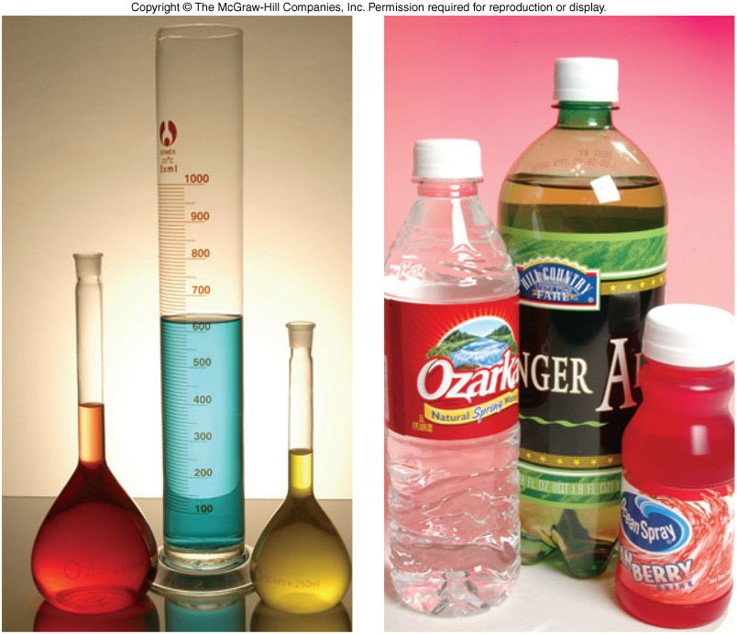
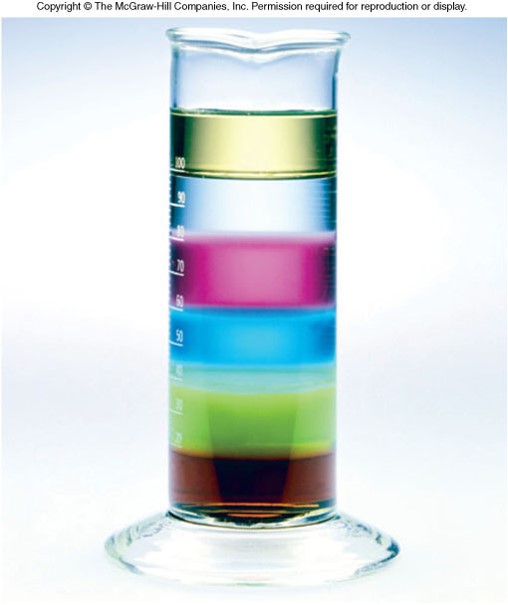
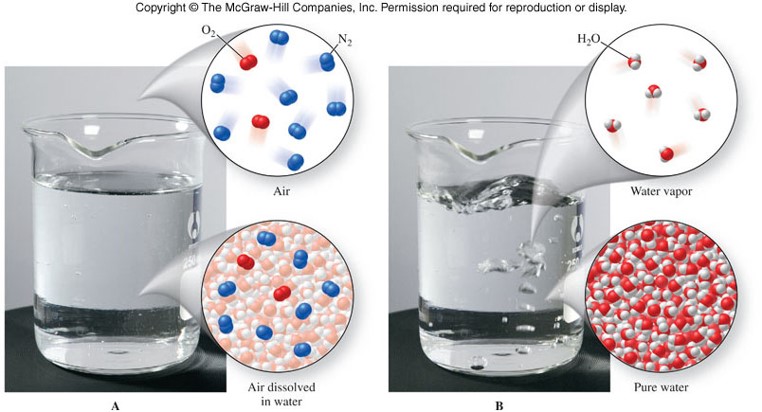
Mixtures
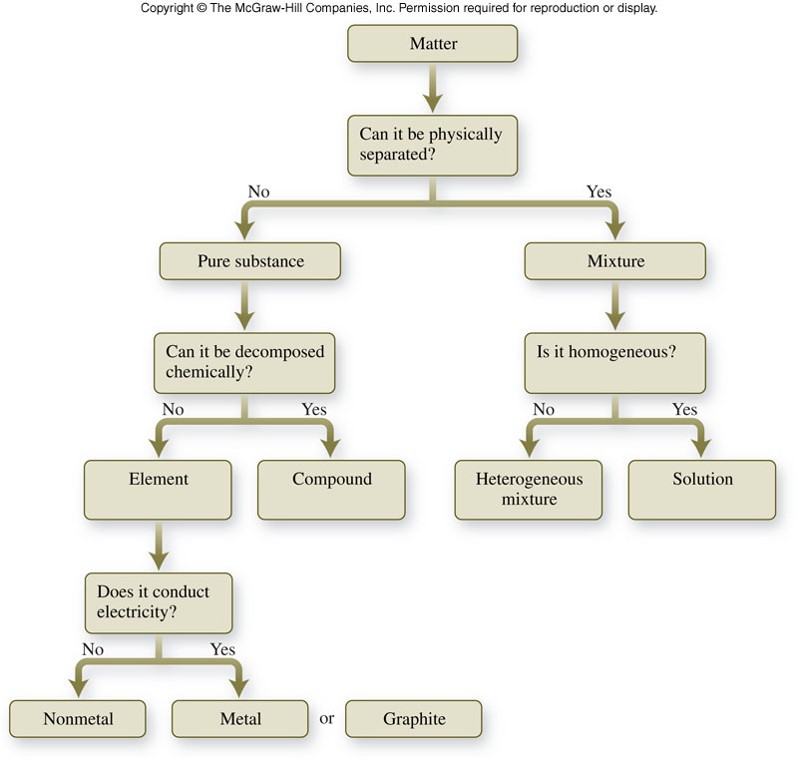
Classification of Matter
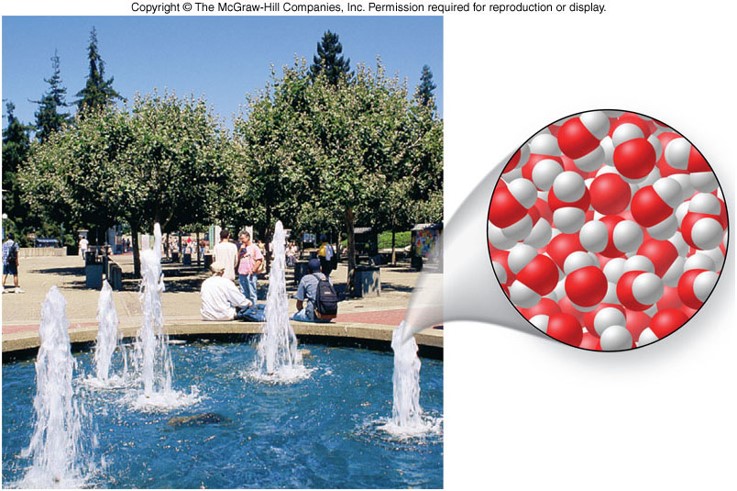
Representations of Matter
- Matter is composed of atoms.
- An atom is the smallest unit of an element that retains the chemical properties of that element.
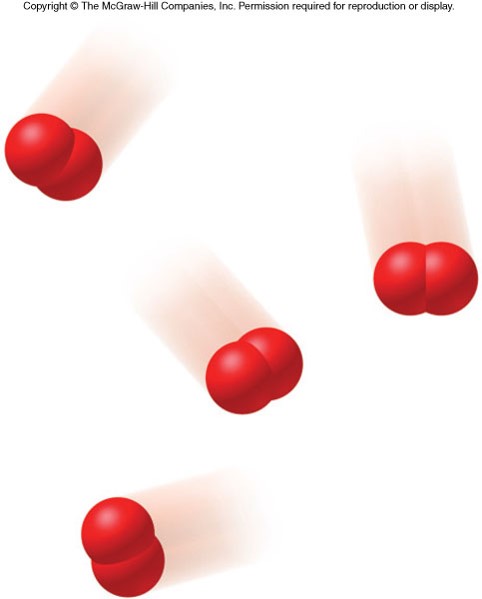
Representations of Matter 2
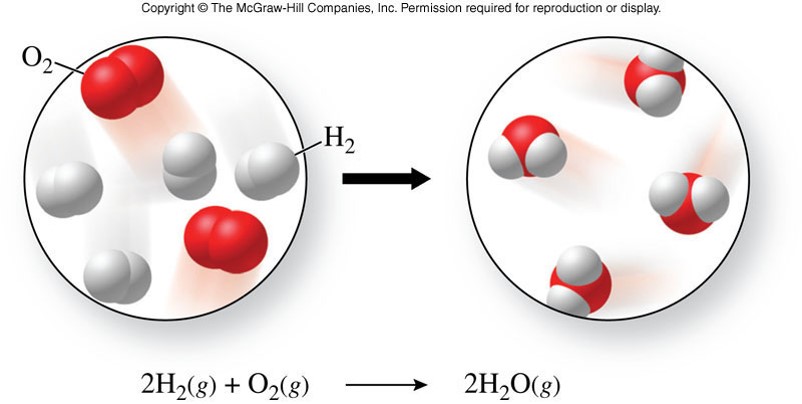
- Atoms can combine together to form molecules.
- Molecules are composed of two or more atoms bound together in a discrete arrangement.
- The atoms bound together in a molecule can be from the same element or from different elements.
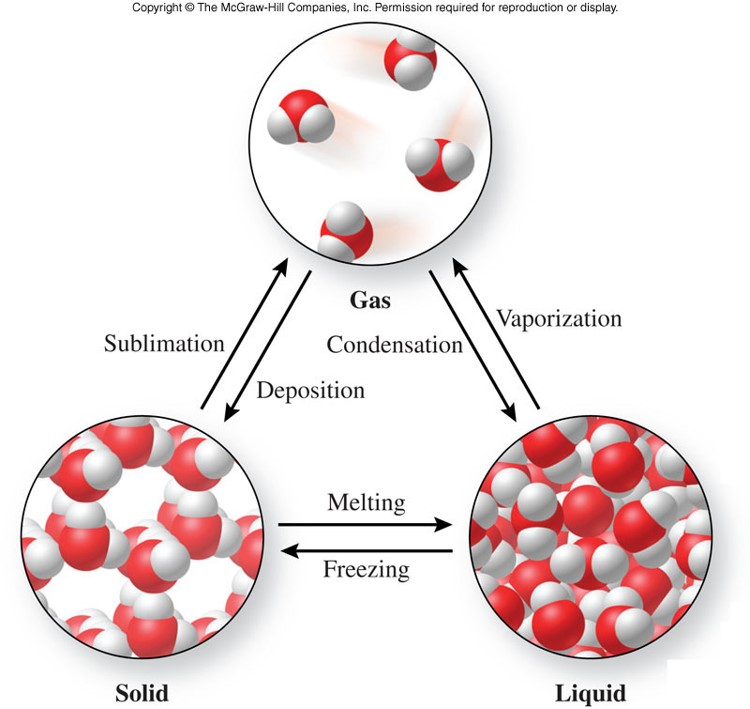
States of Matter
- Discuss the following questions with someone near you.
- How does a solid differ from a liquid?
- How does a gas differ from a liquid?
- How does a solid differ from a gas?
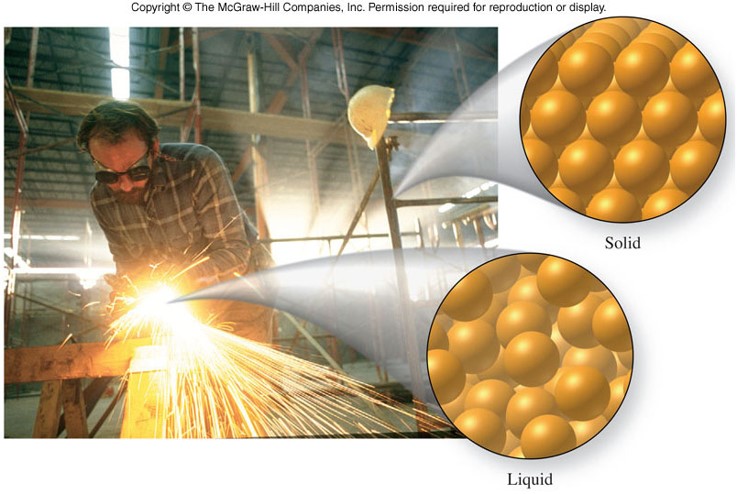
States of Matter
| Solid | Liquid | Gas |
|---|---|---|
| Fixed shape | Shape of continaer (may or may not fill it) | Shape of container (fills it) |
| Its own volume | Its own volume | Volume of container |
| No volume change under pressure | Slight volume change under pressure | Large volume change under pressure |
| Particles are fixed in place in a regular array | Particles are randomly arranged and free to move about until they bump into one another | Particles are widely separated and move independently of one another |
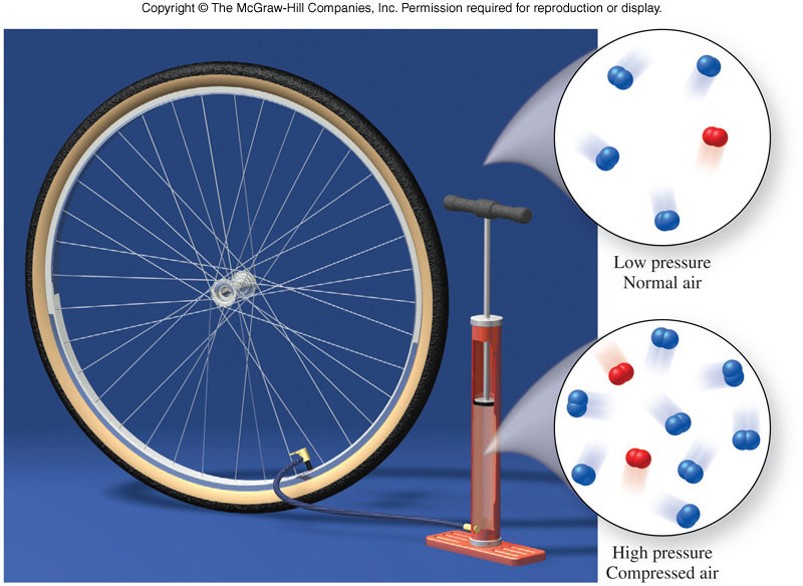
States of Matter - Solid and Gas
States of Matter - Gas under Pressure
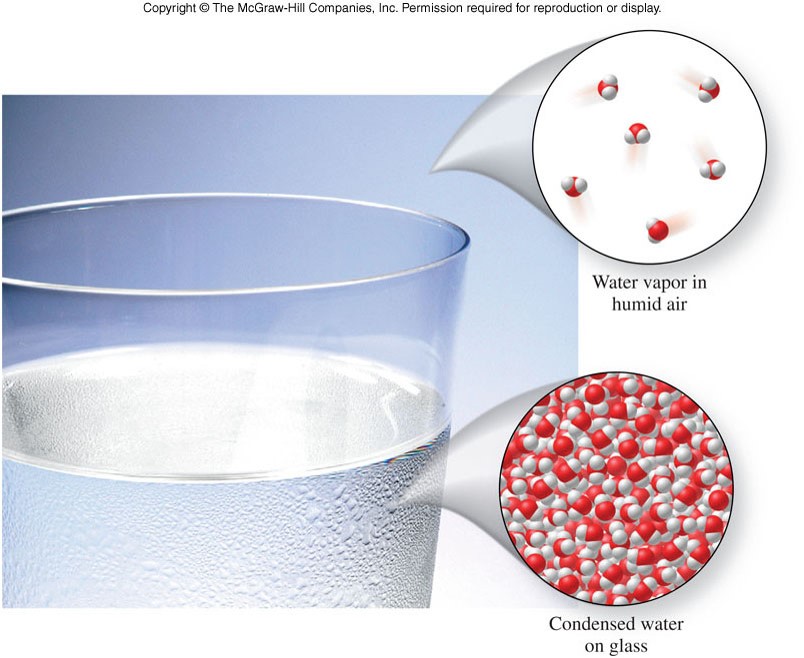
States of Matter - Liquid and Gas
Symbols Used in Chemistry
- Elemental symbols
- a shorthand version of an element's longer name
- can be 1-2 letters and can be derived from the Latin or Greek name [ex. \(\chem{Ag}\)]
- Chemical formulas
- describe the composition of a compound
- use the symbols for the elements in that compound [ex. \(\chem{H_2O}\) and \(\chem{CO_2}\)]
Symbols Used in Chemistry - Examples
| Name | Symbol |
|---|---|
| helium | He |
| fluorine | F |
| silver | Ag |
| water | \(\chem{H_2O}\) |
| carbon dioxide | \(\chem{CO_2}\) |
| methane (natural gas) | \(\chem{CH_4}\) |
Symbols Used in Chemistry - Examples of Water
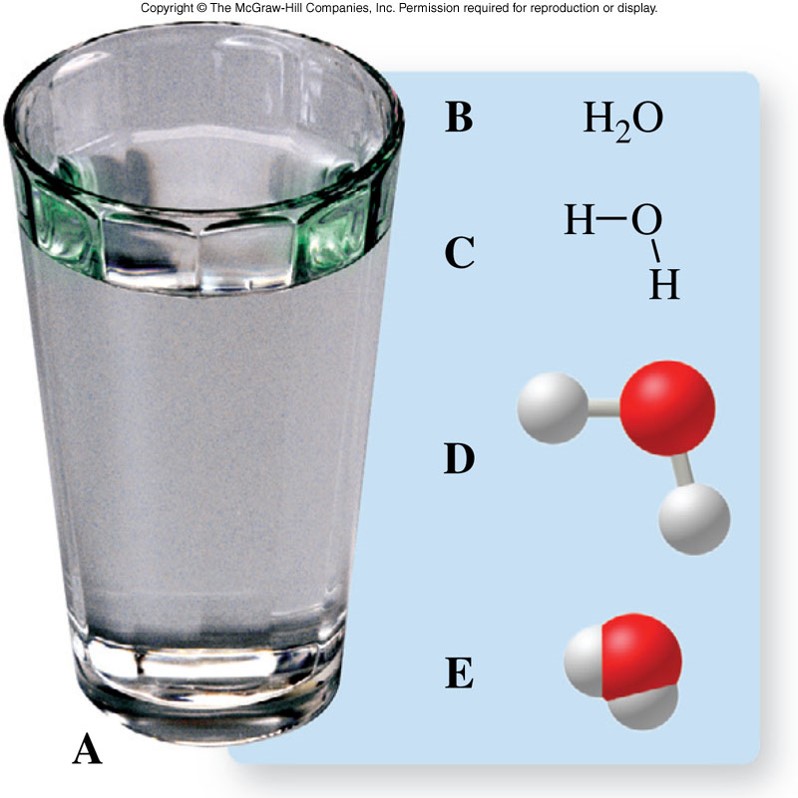
Symbols Used in Chemistry - Phases
- Symbols for physical states
- are found in parenthesis by the elemental symbol or chemical formula
- designate the physical state [ex. solid, liquid, gas, aqueous]
- See table to the right
| Name | Symbol |
|---|---|
| solid | (s) |
| liquid | (l) |
| gas | (g) |
| aqueous (dissolved in water) | (aq) |
Physical and Chemical Changes and Properties of Matter
Physical Properties of Matter
- Physical properties
- are properties that can be observed without changing the composition of the substance
- Four common physical properties are:
- mass
- volume
- density
- temperature
Mass
- Mass:
- measures the quantity of matter
- is essentially the same physical quantity as weight, with the exception that weight is bound by gravity, mass is not
- common units are grams (g)

Volume
- Volume:
- amount of space a substance occupies
- can be calculated by measuring the sides of a cube or rectangular side, then multiplying them \[ \chem{Volume = l \times w \times h} \]
- common units are centimeters cubed (\(\chem{cm^3}\)) or milliliters (\(\chem{mL}\))
Density
- Density:
- the ratio of the mass to its volume \[ \chem{density = \frac{mass}{volume}} \]
- units are \( \bfrac{g}{mL} \) (solids and liquids) or \( \bfrac{g}{L} \) (gases)
- See Table 1.4 for a listing of densities for common substances
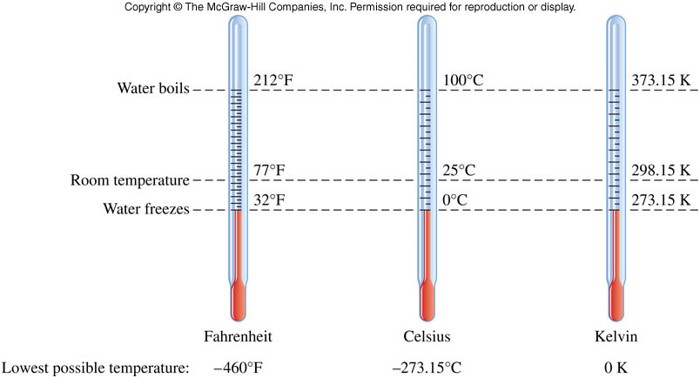
Temperature
- Temperature:
- a measure of how hot or cold something is relative to some standard
- is measured with a thermometer
- at which a phase change occurs is independent of sample size
- units are degrees Celsius (\( \chem{{}^\circ C} \)) and degrees Kelvin (\(\chem{K}\)) \[ \chem{T_K = T_{{}^\circ C} + 273.15} \] \[ \chem{T_{{}^\circ F} = 1.8 \left( T_{{}^\circ C} \right) + 32} \]
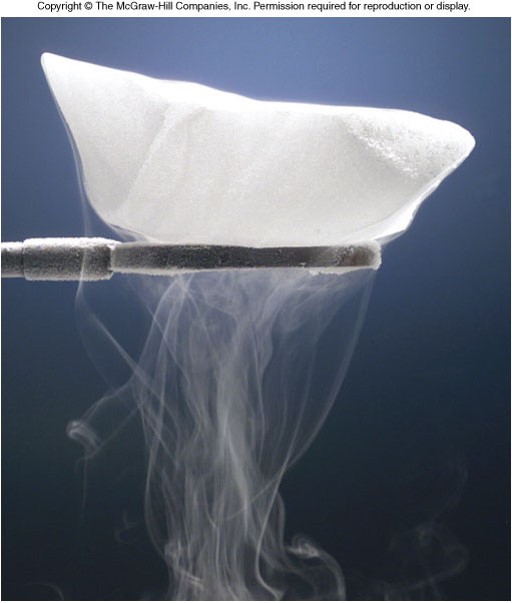
Physical Changes
- A physical change
- is a process that changes the physical properties of a substance without changing its chemical composition
- evidence of a physical change includes:
- a change of state
- Example: water changes from a solid to a gas
- an expected change in color
- a change of state
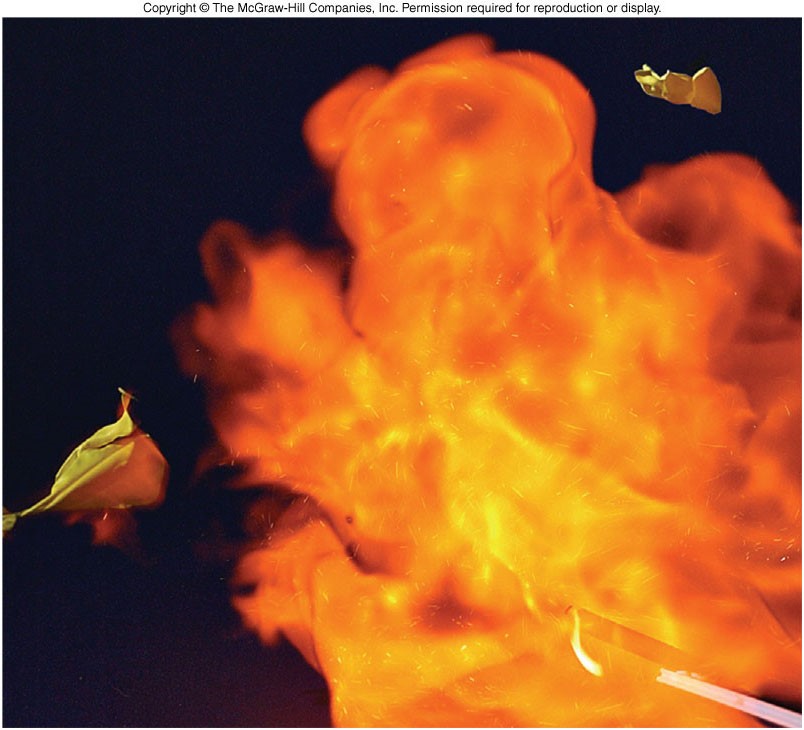
Chemical Changes
- A chemical change
- is a process in which one or more substances are converted into one or more new substances
- also called a chemical reaction
- evidence of a chemical change includes:
- bubbling
- a permanent color change
- a sudden change in temperature
Chemical Properties
- Defined by what it is composed of and what chemical changes it can undergo
Energy and Energy Change
What is Energy?
- Energy
- is the capacity to do work or to transfer heat
- Two main forms of energy are:
- Kinetic energy: the energy of motion
- Potential energy: energy possessed by an object because of its position
- Other energies are forms of kinetic and potential energy (chemical, mechanical, electrical, heat, etc.)
Example: Energy Change
Energy Units
- Units for energy are calories or joules
\[ \chem{4.184\, J = 1\, cal} \]
- A calorie is the amount of energy required to raise \( \chem{1\, g} \) of water by \( \chem{1^\circ C}\).
- A kilojoule (kJ) or 1000 joules (J) is approximately the amount of energy that is emitted when a kitchen match burns completely.
Example: Energy Units
The Scientific Method
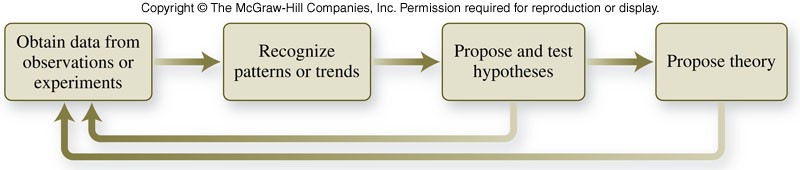
What is the scientific method?
- is an approach to asking questions and seeking answers that employs a variety of tools, techniques, and strategies
- The method generally includes observations, hypotheses, laws, and theories.
Some parts of the scientific method
- Observations include:
- experimentation
- collection of data
- A hypothesis is a tentative explanation for the properties or behavior of matter that accounts for a set of observations and can be tested.
- A scientific law describes the way nature operates under a specified set of conditions.
- Theories explain why observations, hypotheses, or laws apply under many different circumstances.
Flowchart of the Scientific Method
Math
Scientific Notation
- A number written in scientific notation is expressed as: \[ C \times 10^n \] where \(C\) is the coefficient (a number with only one digit to the left of the decimal point) and \(n\) is the exponent (a positive or negative integer)
- Move the decimal point in the number until just one nonzero digit is to the left of the decimal point. The final number is \(C\).
- The exponent on the 10 (\(n\)) is equal to the number of places moved the decimal point.
- If the decimal point is moved to the left, then \(n\) is positive.
- If the decimal point is moved to the right, then \(n\) is negative.
- The exponent on the 10 (\(n\)) is equal to the number of places moved the decimal point.
Scientific Notation - Examples
| Normal Notation | Scientific Notation |
|---|---|
| 3245. | \( 3.245 \times 10^3 \) |
| 0.000003245 | \( 3.245 \times 10^{-6} \) |
| 3,245,000,000 | \( 3.245 \times 10^9 \) |
| 0.0050607 | \( 5.0607 \times 10^{-3} \) |
| 88. | \( 8.8 \times 10^1 \) |
| 2.45 | \( 2.45 \times 10^0 \) |
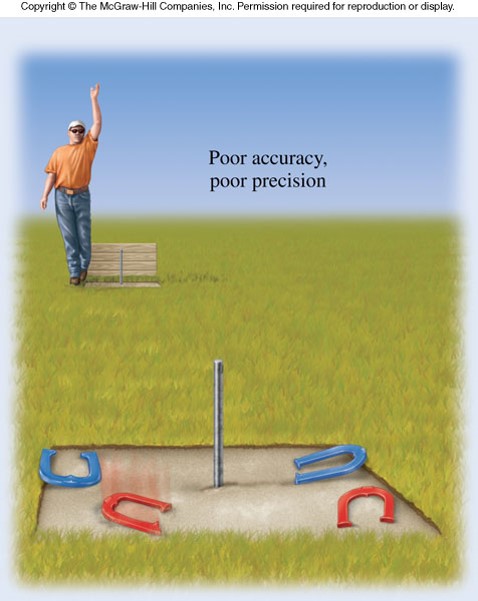
Poor Precision, Poor Accuracy
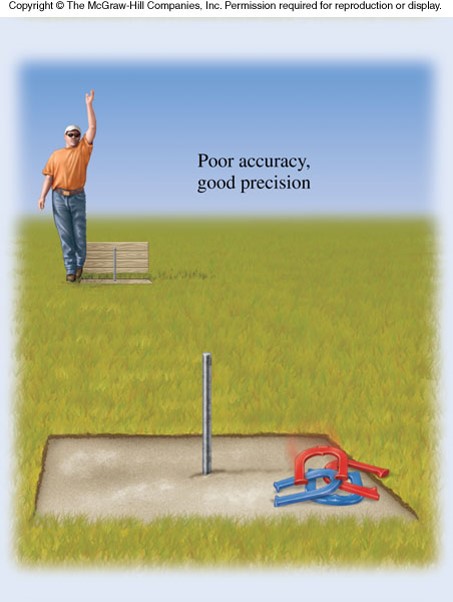
Good Precision, Poor Accuracy
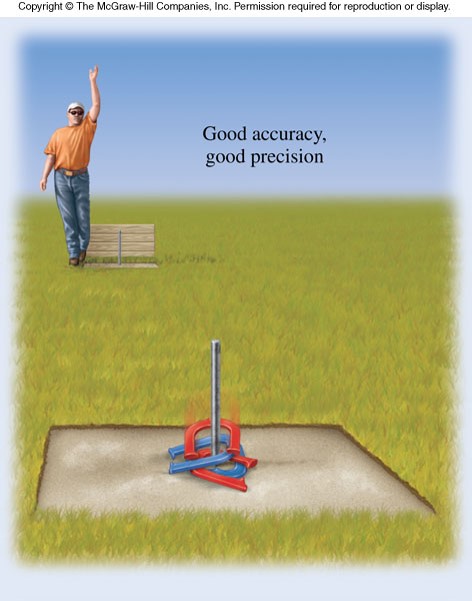
Good Precision, Good Accuracy
Significant Figures - Step 1
Here is a simpler method for determining the number of significant figures in a given measurement.
- Underline the left-most nonzero digit.
- 273.1023
- 0.1023
- 10.025
- 1020
Significant Figures - Step 2
- Look for a written decimal point in the number.
- If the number contains a decimal point, underline the right-most digit.
- 273.1023
- 0.1023
- 10.025
- If the number does not contain a decimal point, underline the right-most nonzero digit.
- 1020
- If the number contains a decimal point, underline the right-most digit.
Significant Figures - Step 3
- Count the number between the underlined numbers (including those underlined)
- 273.1023 ← 7 sig. figs.
- 0.1023 ← 4 sig. figs.
- 10.025 ← 5 sig. figs.
- 1020 ← 3 sig. figs.
Special Types of Numbers
- Exact numbers have an infinite number of significant figures.
- \(1\,\chem{inch}=2.54\,\chem{cm}\), exactly (by definition).
- \(9\) pencils (obtained by counting).
Significant Figures in Mathematical Operations
- For multiplication or division, the number of significant figures in the result is the same as the number in the least precise measurement used in the calculation. $$ 1.342 \times \underline{5.5} = 7.381 \xrightarrow{\chem{round}} \underline{7.4} $$
- For addition or subtraction, the result has the same number of decimal places as the least precise measurement used in the calculation. $$ 23.445 + 7.8\underline{3} = 31.275 \xrightarrow{\chem{round}} 31.2\underline{8} $$
Units
- Measurement
- is the determination of the size of a particular quantity
- Measurements are defined by both a quantity (number) and unit.
- Most scientists use SI (from the French for Système Internationale) units (see top chart or chart on pg. 39).
| Unit | Symbol | Quantity |
|---|---|---|
| meter | m | length |
| kilogram | kg | mass |
| second | s | time |
| ampere | A | electric current |
| Kelvin | K | temperature |
| mole | mol | amount of substance |
Units - Prefixes
- Scientists also use the metric system to define base units of measure, with the understanding that a special prefix denotes fractions or multiples of that base (see chart on right).
| Prefix | Factor | Symbol |
|---|---|---|
| giga | \( 10^9 \) | G |
| mega | \( 10^6 \) | M |
| kilo | \( 10^3 \) | k |
| deci | \( 10^{-1} \) | d |
| centi | \( 10^{-2} \) | c |
| milli | \( 10^{-3} \) | m |
| micro | \( 10^{-6} \) | μ |
| nano | \( 10^{-9} \) | n |
Unit Analysis
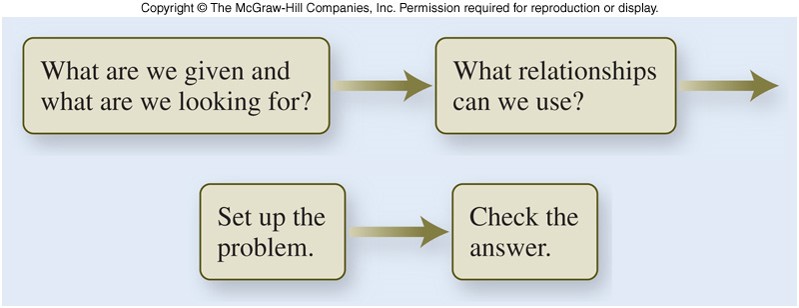
A possible approach to problem solving involves 4 steps:
- Decide what the problem is asking for.
- Decide what relationships exist between the information given in the problem and the desired quantity.
- Set up the problem logically, using the relationships decided upon in step 2.
- Check the answer to make sure it makes sense, both in magnitude and units.
Unit Analysis - Flowchart
/