Chapter 10
Liquids and Solids
Shaun Williams, PhD
Intermolecular Bonding
Intramolecular Bonding
- "Within" the molecule.
- Molecules are formed by sharing electrons between the atoms.
Intermolecular Forces
- Forces that occur between molecules.
- Dipole–dipole forces
- London dispersion forces
- Intramolecular bonds are stronger than intermolecular forces.
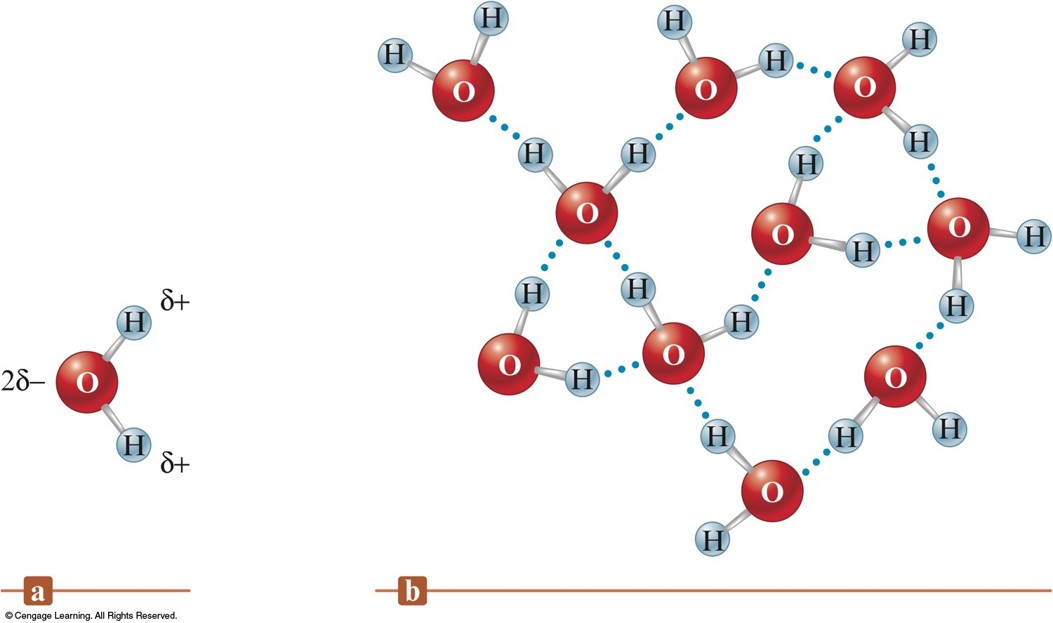
Hydrogen Bonding in Water
- Blue dotted lines are the intermolecular forces between the water molecules.
Phases Changes
- When a substance changes from solid to liquid to gas, the molecules remain intact.
- The changes in state are due to changes in the forces among molecules rather than in those within the molecules.
Schematic Representation of the Three States of Matter
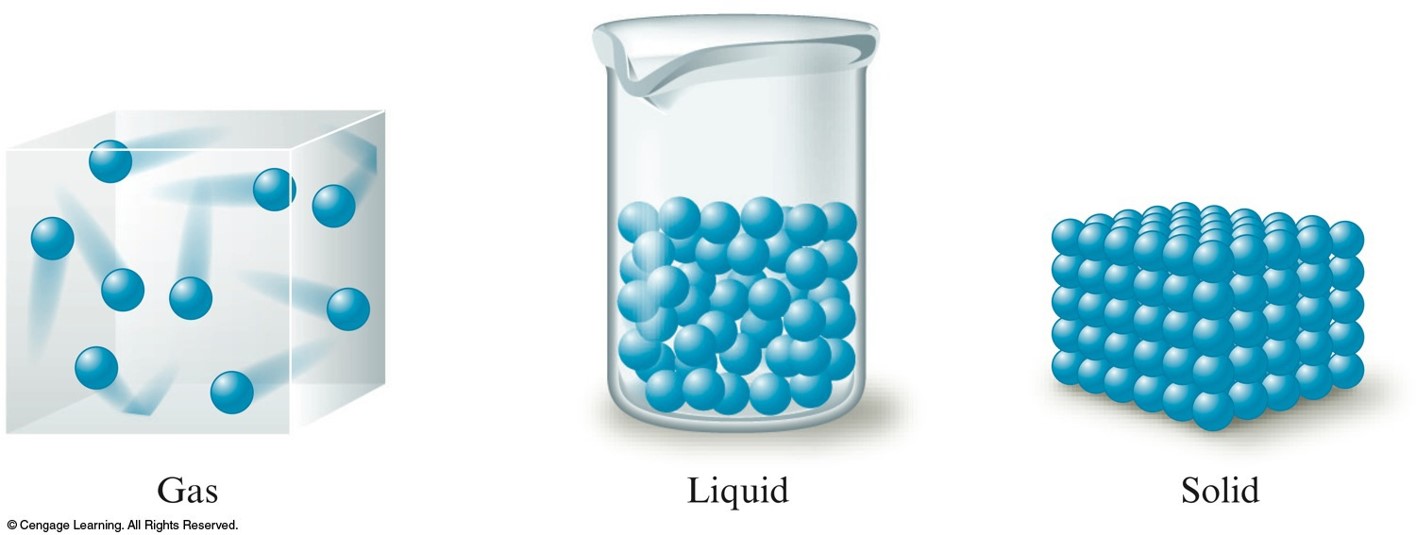
Phases Changes at the Molecular Level
- Solid to Liquid
- As energy is added, the motions of the molecules increase, and they eventually achieve the greater movement and disorder characteristic of a liquid.
- Liquid to Gas
- As more energy is added, the gaseous state is eventually reached, with the individual molecules far apart and interacting relatively little.
Densities of the Three States of Water
| State |
Density (\( \bfrac{\text{g}}{\text{cm}^3} \)) |
| Solid (\(0^\circ\,\text{C}, 1\,\text{atm}\)) |
\( 0.9168 \) |
| Liquid (\(25^\circ\,\text{C}, 1\,\text{atm}\)) |
\( 0.9971 \) |
| Gas (\(400^\circ\,\text{C}, 1\,\text{atm}\)) |
\( 3.26 \times 10^{-4} \) |
Dipole-Dipole Forces
- Dipole moment – molecules with polar bonds often behave in an electric field as if they had a center of positive charge and a center of negative charge.
- Molecules with dipole moments can attract each other electrostatically. They line up so that the positive and negative ends are close to each other.
- Only about 1% as strong as covalent or ionic bonds.
Hydrogen Bonding
- Strong dipole-dipole forces.
- Hydrogen is bound to a highly electronegative atom – nitrogen, oxygen, or fluorine.
- That same hydrogen is then electrostatically attracted to a lone pair on the nitrogen, oxygen or fluorine on adjacent molecules.
London Dispersion Forces
- Instantaneous dipole that occurs accidentally in a given atom induces a similar dipole in a neighboring atom.
- Significant in large atoms/molecules.
- Occurs in all molecules, including nonpolar ones.
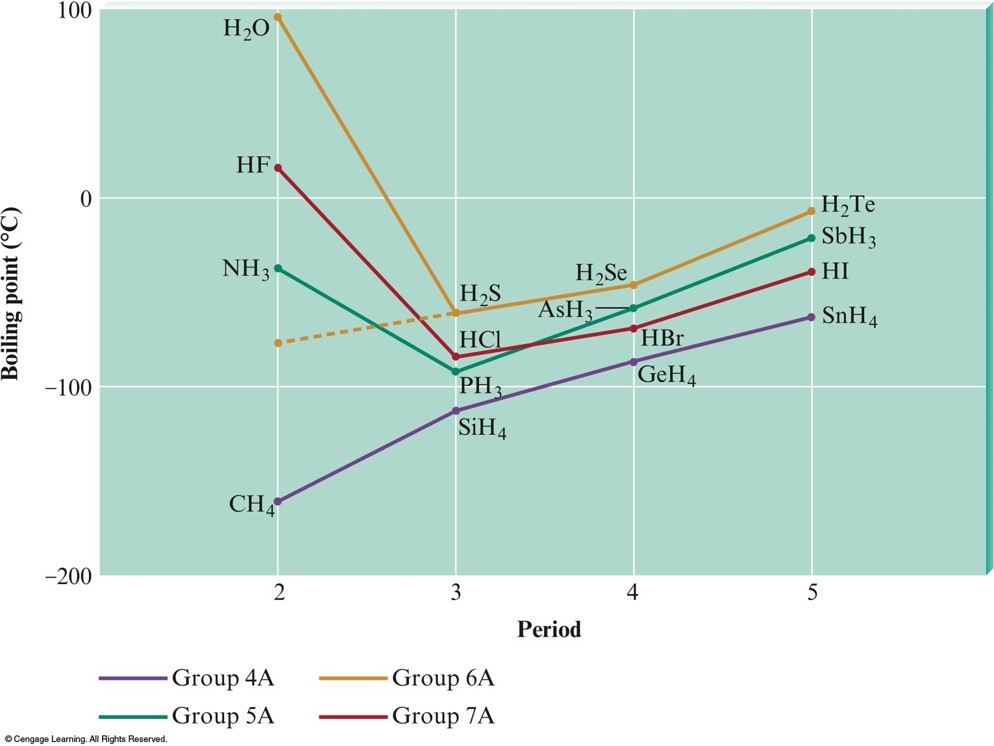
Melting and Boiling Points
- In general, the stronger the intermolecular forces, the higher the melting and boiling points.
Concept Check 1
Which gas would behave more ideally at the same conditions of P and T?
$$ \chem{CO}\;\;\;\; \text{ or }\;\;\;\; \chem{N_2} $$
Why?
Concept Check 1 - Answer
Which gas would behave more ideally at the same conditions of P and T?
$$ \chem{CO}\;\;\;\; \text{ or }\;\;\;\; \color{green} \chem{N_2} $$
Why?
\(\chem{N_2}\) would behave more ideally because it is nonpolar and only exhibits London dispersion forces, therefore the intermolecular forces between \(\chem{N_2}\) molecules are weak (and thus the collisions will be more "elastic"). \(\chem{CO}\) also exhibits dipole-dipole interactions.
The Liquid State
Liquids
- Low compressibility, lack of rigidity, and high density compared with gases.
- Surface tension - resistance of a liquid to an increase in its surface area:
- Liquids with large intermolecular forces tend to have high surface tensions.
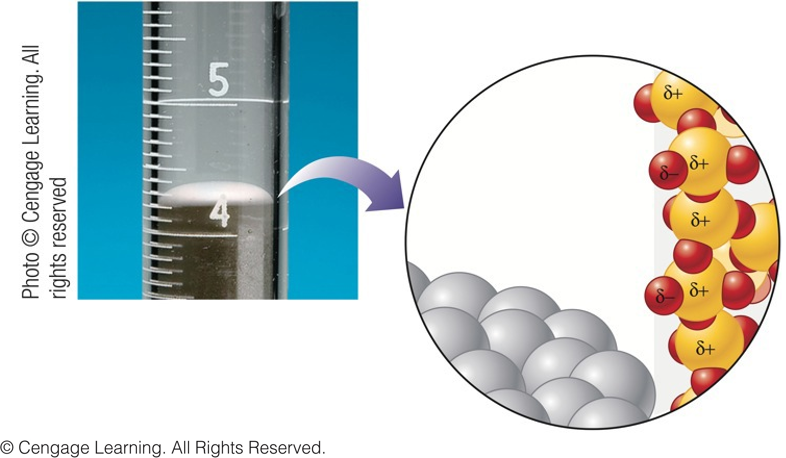
- Capillary action - spontaneous rising of a liquid in a narrow tube:
- Cohesive forces - intermolecular forces among the molecules of the liquid.
- Adhesive forces - forces between the liquid molecules and their container.
Convex Meniscus Formed by Nonpolar Liquid Mercury
- Which force dominates alongside the glass tube – cohesive or adhesive forces?
$$ \color{blue}\text{cohesive forces} $$
Concave Meniscus Formed by Polar Water
- Which force dominates alongside the glass tube – cohesive or adhesive forces?
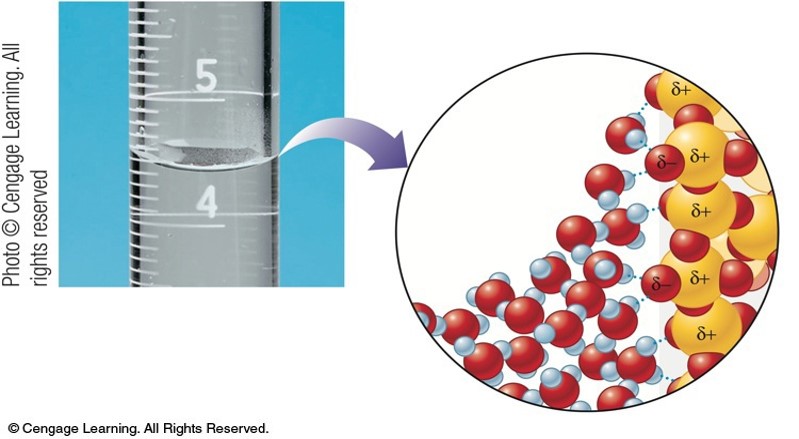
$$ \color{blue}\text{adhesive forces} $$
Liquids
- Viscosity - measure of a liquid's resistance to flow:
- Liquids with large intermolecular forces or molecular complexity tend to be highly viscous.
An Introduction to Structures and Types of Solids
Solids
- Amorphous Solids:
- Disorder in the structures
- Glass
- Crystalline Solids:
- Ordered Structures
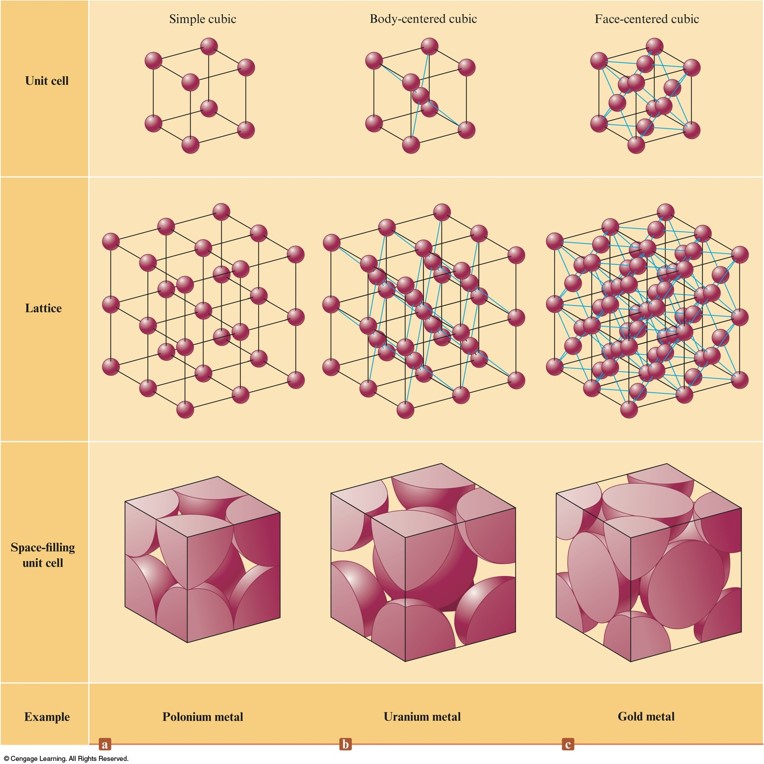
- Unit Cells
Three Cubic Unit Cells and the Corresponding Lattices
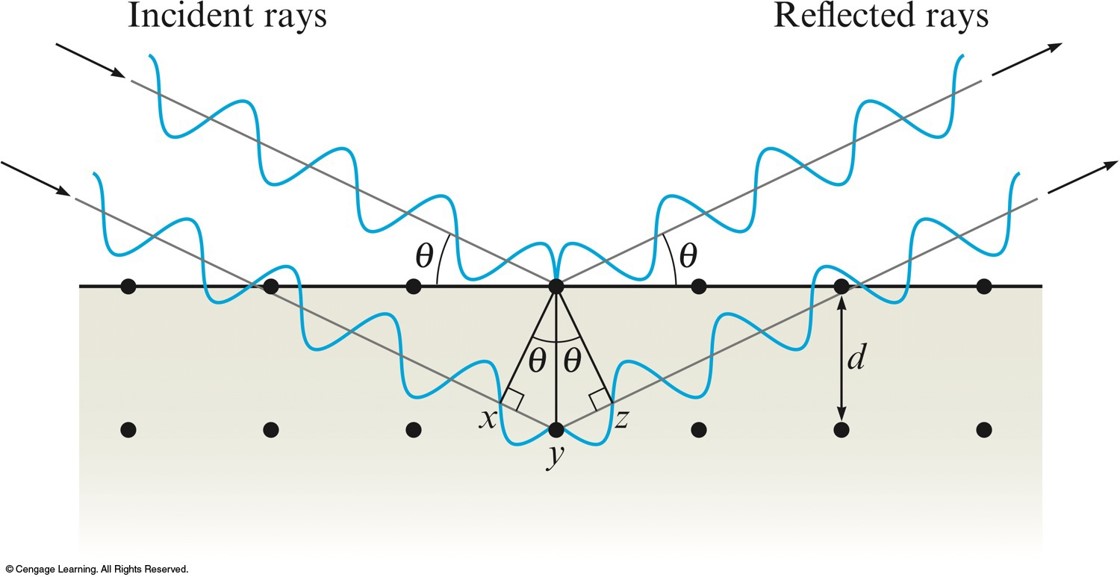
Bragg Equation
- Used to determine the interatomic spacings.
$$ n\lambda = 2d \sin \theta $$
- \(n\) - integer
- \(\lambda\) - wavelength of the x-rays
- \(d\) - distance between the atoms
- \(\theta\) - angle of incidence and reflection
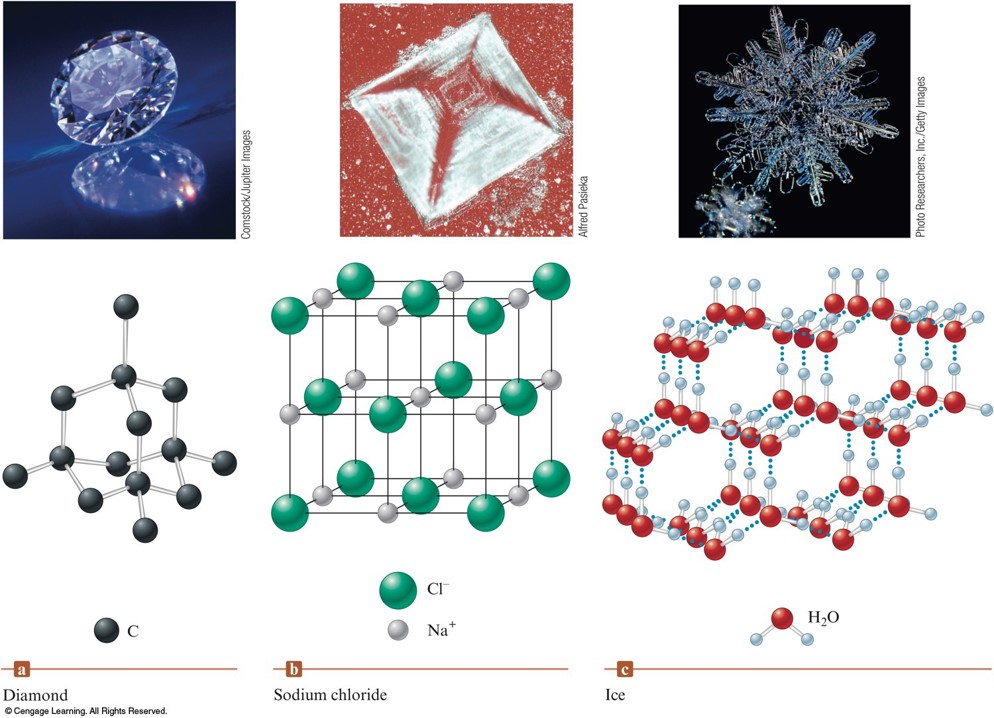
Types of Crystalline Solids
- Ionic Solids - ions at the points of the lattice that describes the structure of the solid.
- Molecular Solids - discrete covalently bonded molecules at each of its lattice points.
- Atomic Solids - atoms at the lattice points that describe the structure of the solid.
Examples of Three Types of Crystalline Solids
Classification of Solids
|
Atomic Solids |
|
|
|
Metallic |
Network |
Group 18 |
Molecular Solids |
Ionic Solids |
Components That Occupy
the Lattice Points |
Metal atoms |
Nonmetal atoms |
Group 18 atoms |
Discrete molecules |
Ions |
| Bonding |
Delocalized covalent |
Directional covalent (leading to giant molecules) |
London dispersion forces |
Dipole-dipole and/or London dispersion forces |
Ionic |
Structure and Bonding in Metals
Closest Packing Model
- Closest Packing:
- Assumes that metal atoms are uniform, hard spheres.
- Spheres are packed in layers.
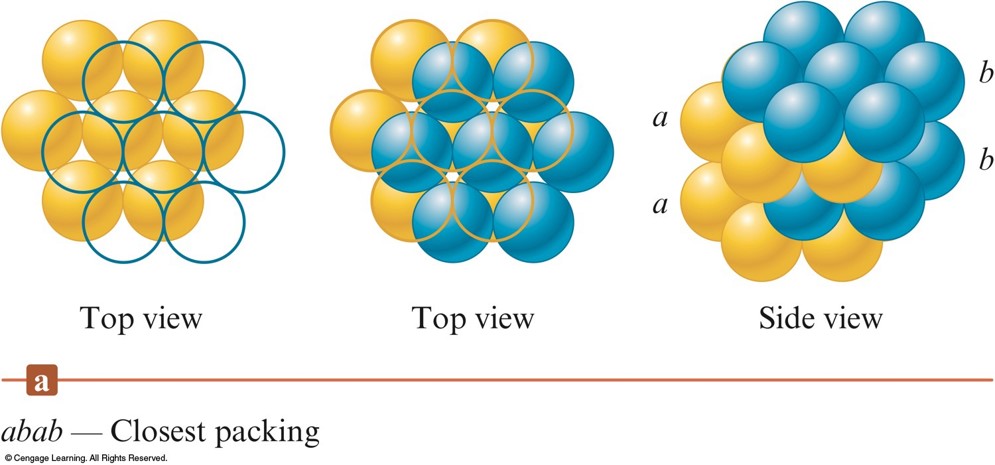
The Closest Packing Arrangement of Uniform Spheres
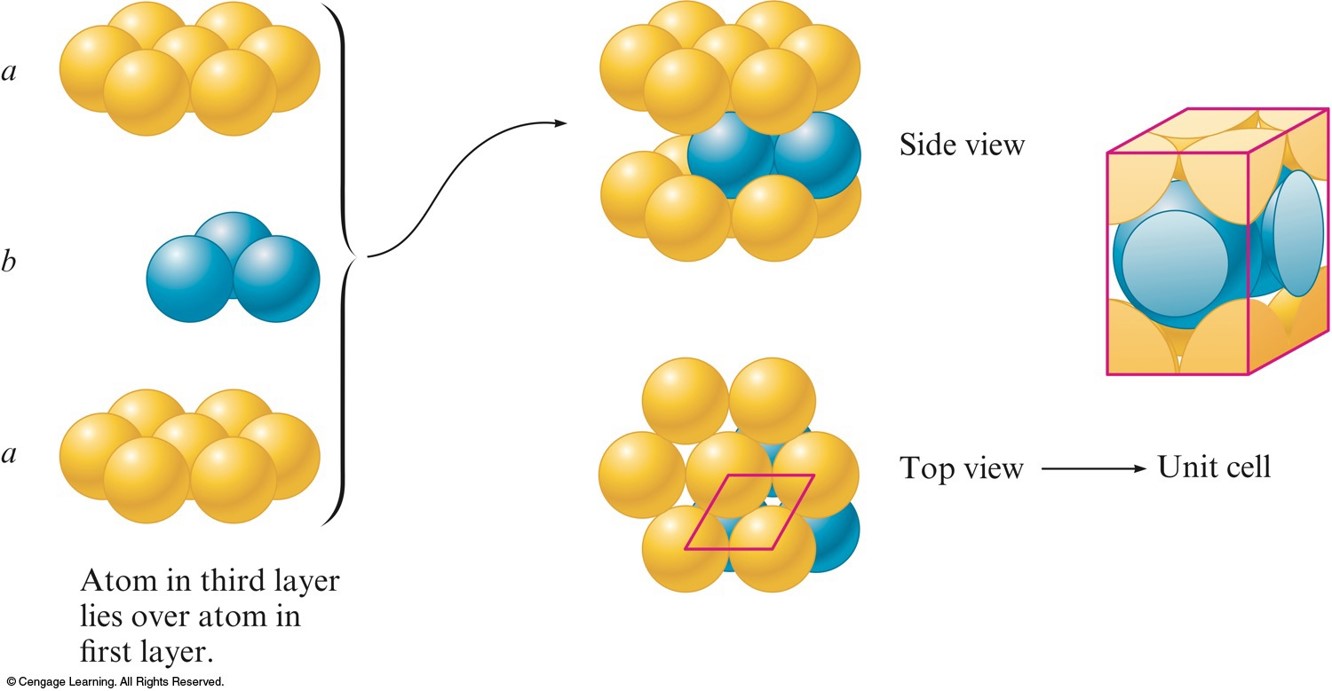
- abab packing - the 2nd layer is like the 1st but it is displaced so that each sphere in the 2nd layer occupies a dimple in the 1st layer.
- The spheres in the 3rd layer occupy dimples in the 2nd layer so that the spheres in the 3rd layer lie directly over those in the 1st layer.
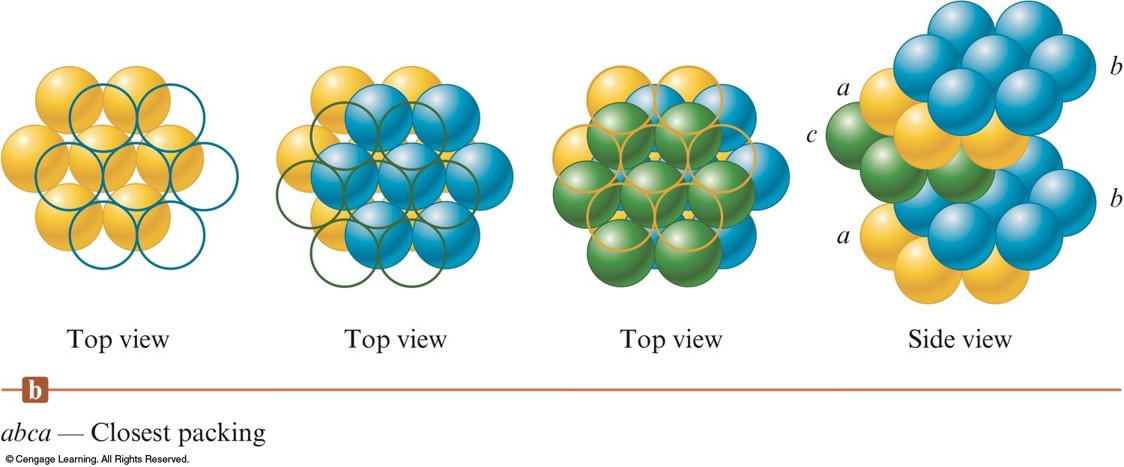
The Closest Packing Arrangement of Uniform Spheres - cont.
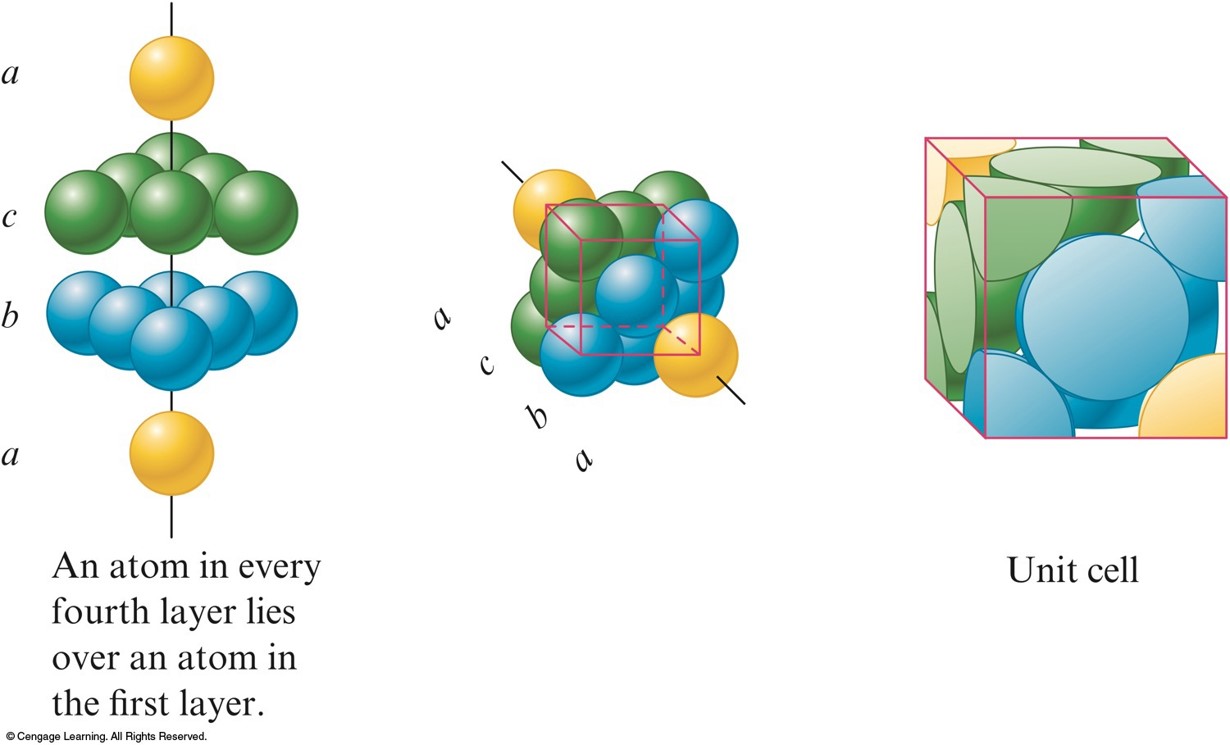
- abca packing - the spheres in the 3rd layer occupy dimples in the 2nd layer so that no spheres in the 3rd layer lie above any in the 1st layer.
- The 4th layer is like the 1st.
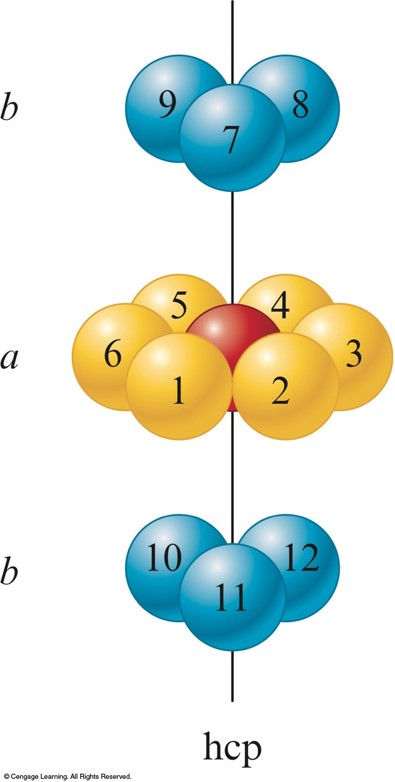
Hexagonal Closest Packing
Cubic Closest Packing
The Indicated Sphere Has 12 Nearest Neighbors
- Each sphere in both ccp and hcp has 12 equivalent nearest neighbors.
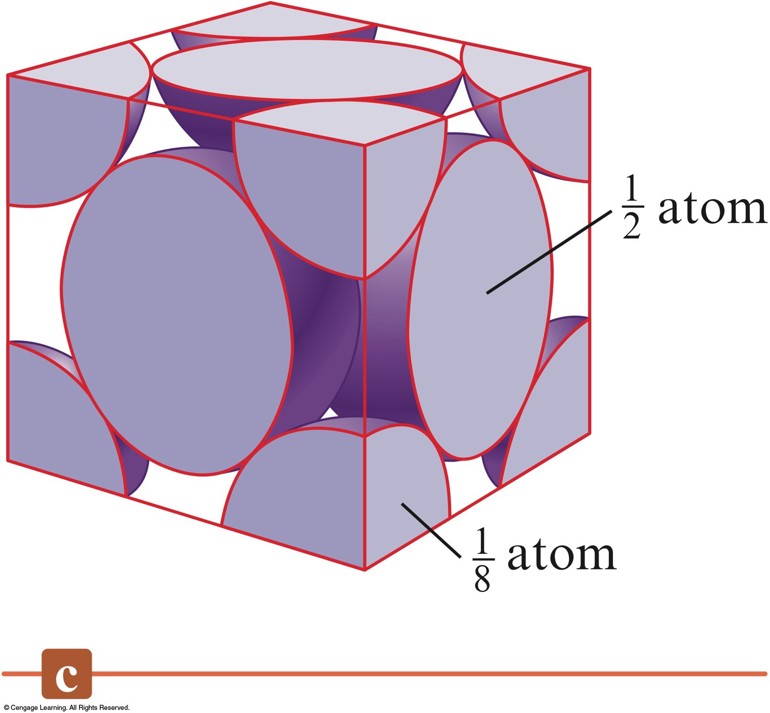
The Net Number of Spheres in a Face-Centered Cubic Unit Cell
Bonding Models for Metals
- Electron Sea Model
- Band Model (MO Model)
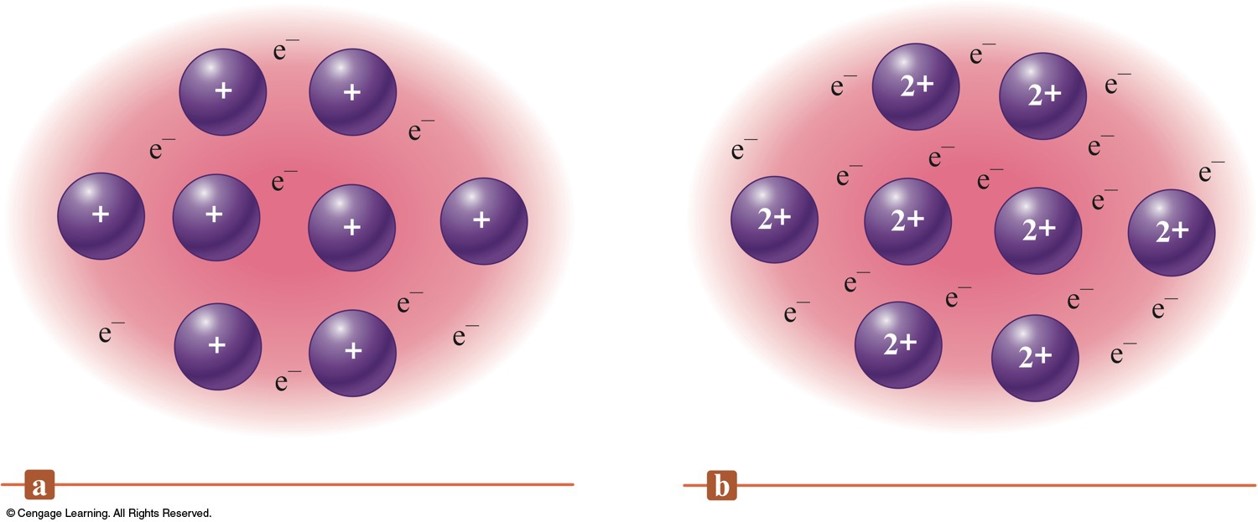
The Electron Sea Model
- A regular array of cations in a "sea" of mobile valence electrons.
Band or Molecular Orbital (MO) Model
- Electrons are assumed to travel around the metal crystal in molecular orbitals formed from the valence atomic orbitals of the metal atoms.
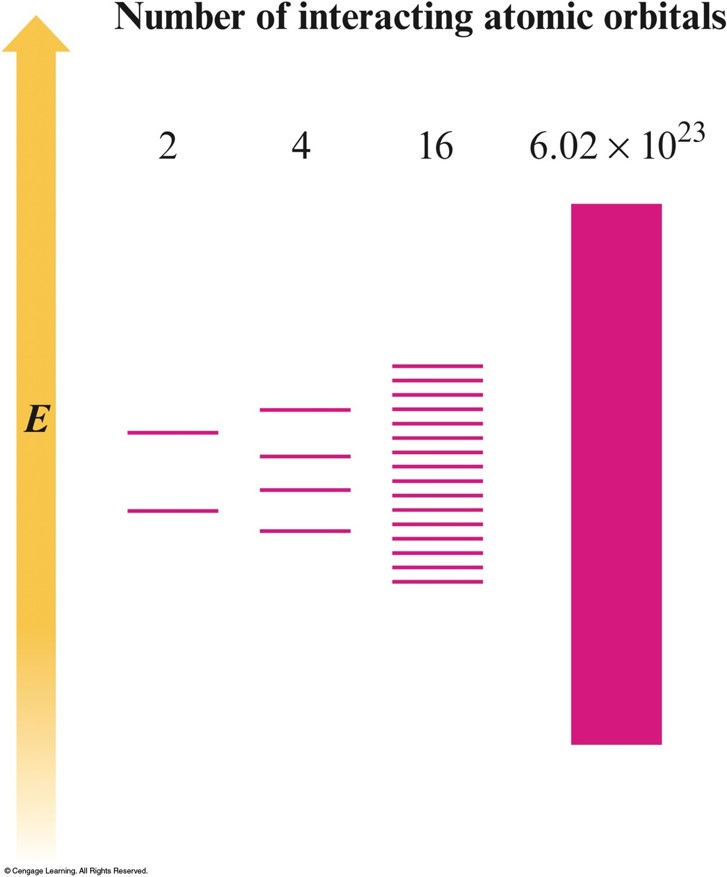
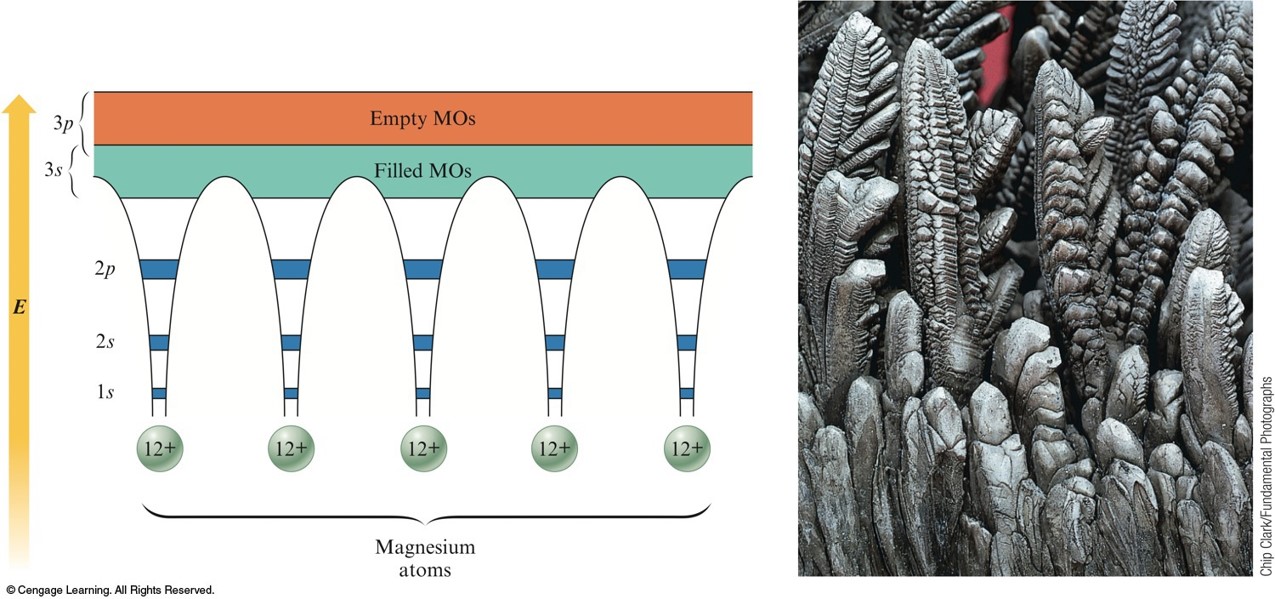
The Band Model for Magnesium
- Virtual continuum of levels, called bands.
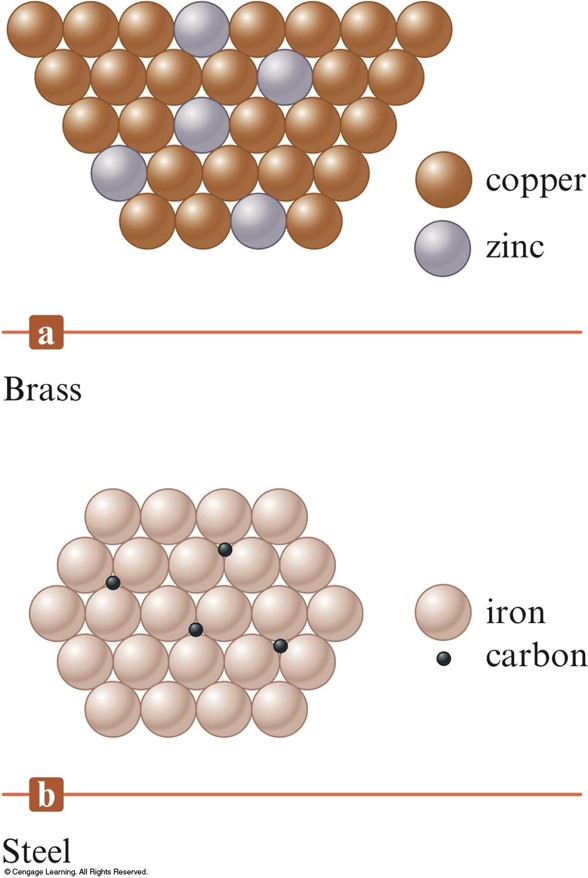
Metal Alloys
- Substitutional Alloy - some of the host metal atoms are replaced by other metal atoms of similar size.
- Interstitial Alloy - some of the holes in the closest packed metal structure are occupied by small atoms.
Two Types of Alloys
- Brass is a substitutional alloy.
- Steel is an interstitial alloy.
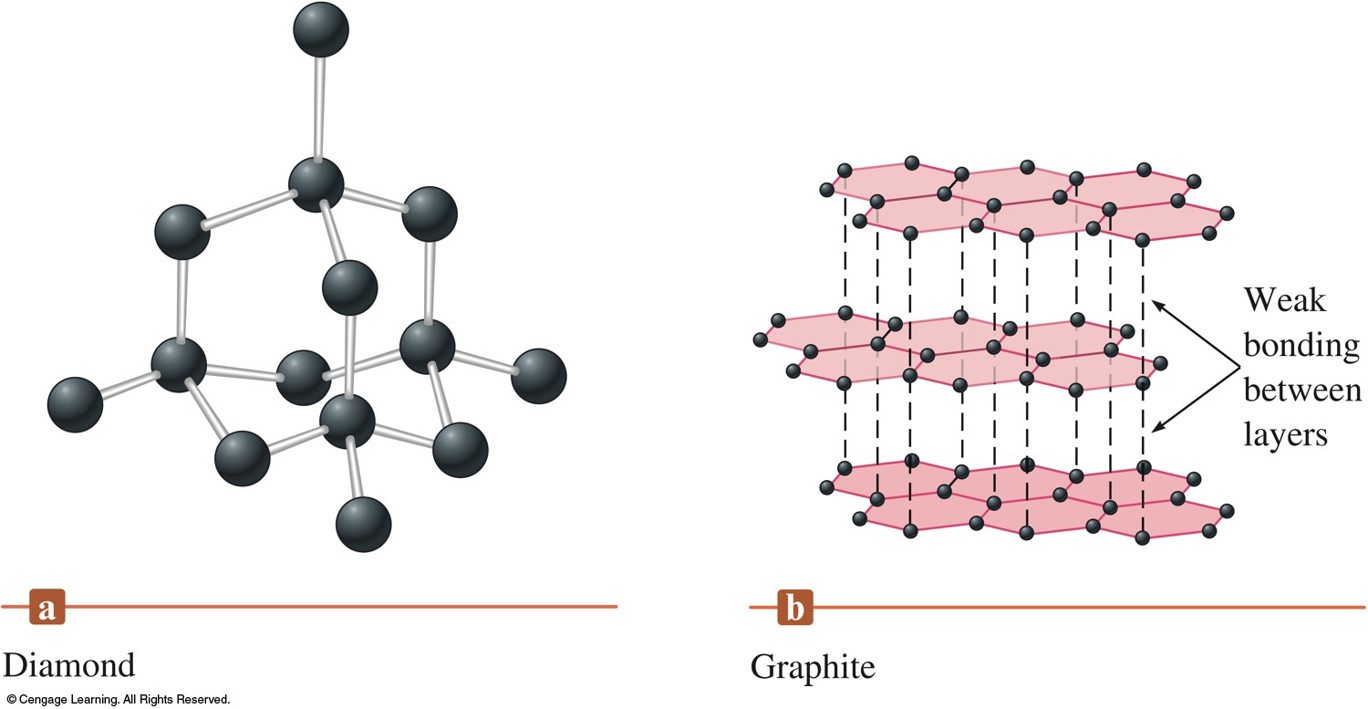
Carbon and Silicon: Network Atomic Solids
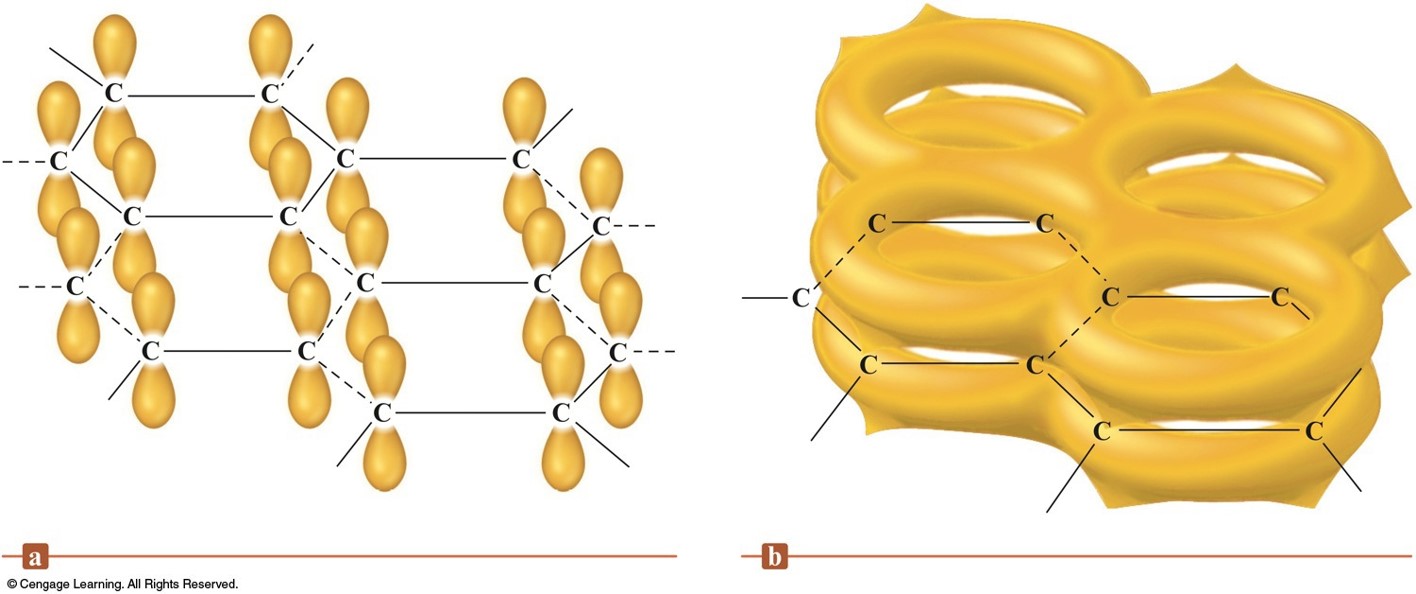
The Structures of Diamond and Graphite
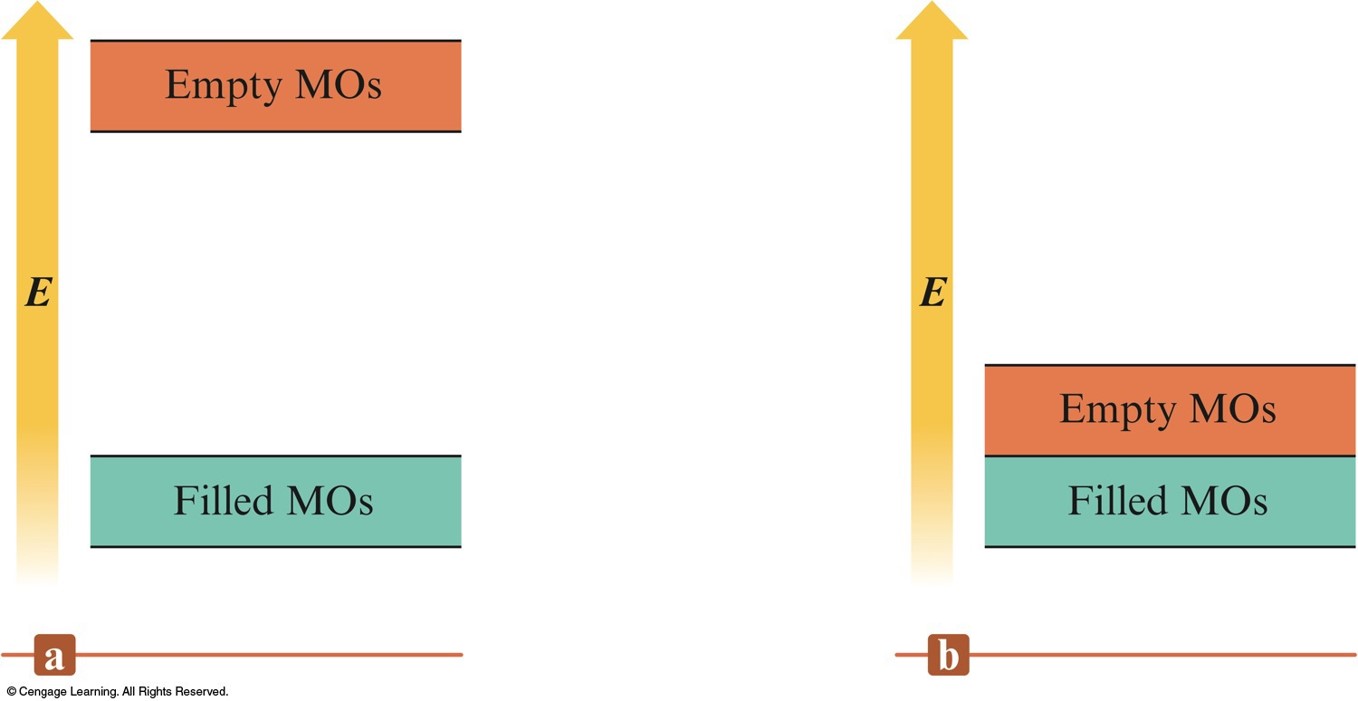
Partial Representation of the Molecular Orbital Energies in Diamond and a Typical Metal
The p Orbitals and Pi-system in Graphite
Ceramics
- Typically made from clays (which contain silicates) and hardened by firing at high temperatures.
- Nonmetallic materials that are strong, brittle, and resistant to heat and attack by chemicals.
Semiconductors
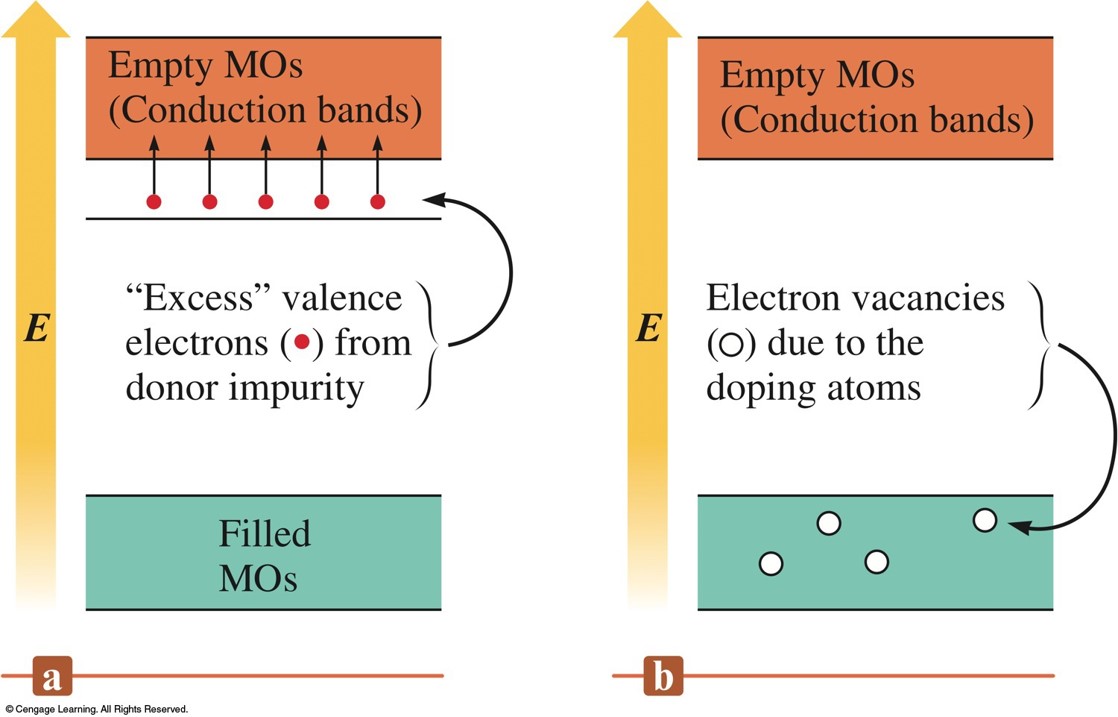
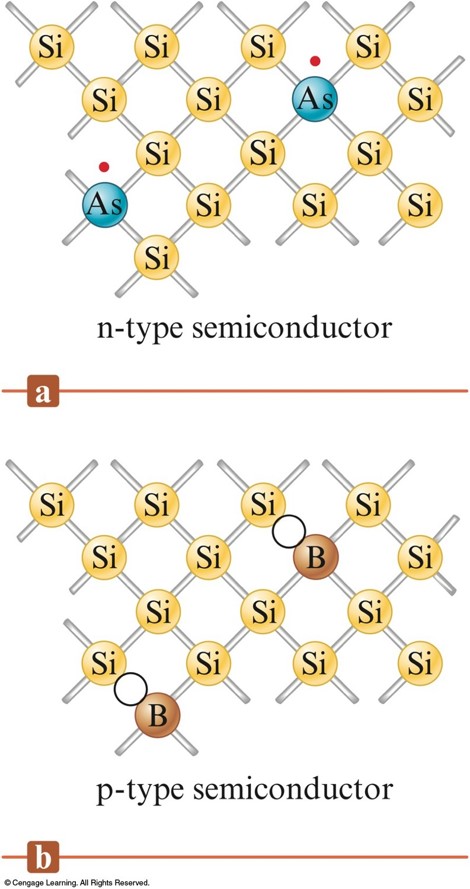
- n-type semiconductor – substance whose conductivity is increased by doping it with atoms having more valence electrons than the atoms in the host crystal.
- p-type semiconductor – substance whose conductivity is increased by doping it with atoms having fewer valence electrons than the atoms of the host crystal.
Energy Level Diagrams for an n-type Semiconductor and a p-type Semiconductor
Silicon Crystal Doped with Arsenic and Boron
Ionic Solids
Ionic Solids
- Ionic solids are stable, high melting substances held together by the strong electrostatic forces that exist between oppositely charged ions.
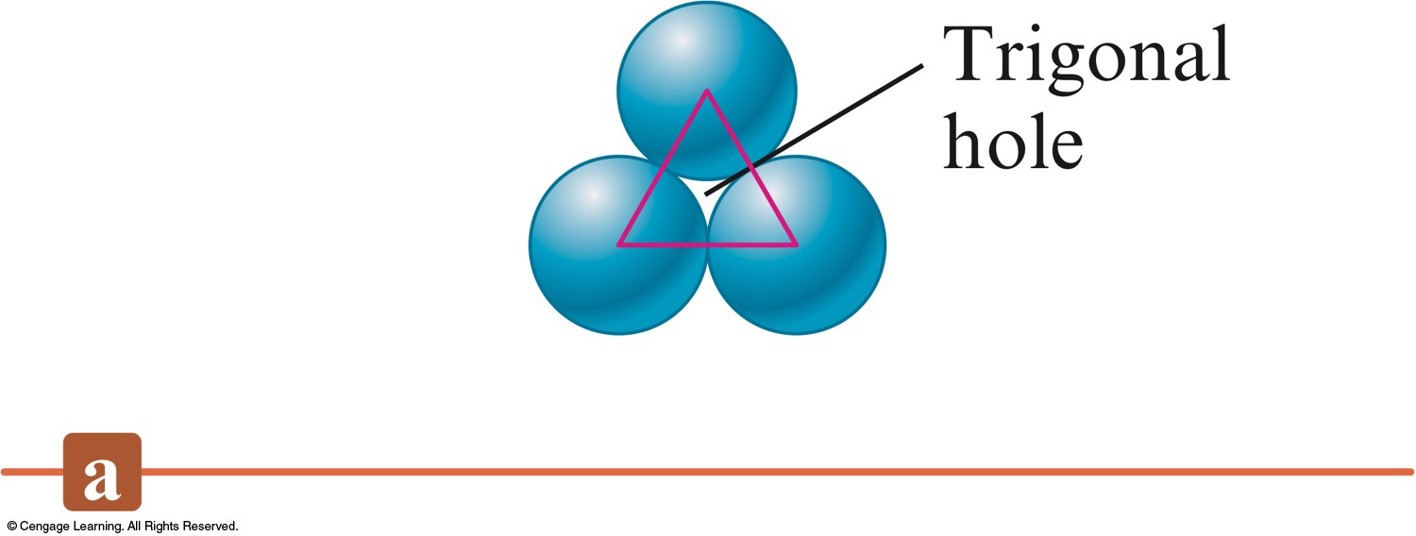
Three Types of Holes in Closest Packed Structures
- Trigonal holes are formed by three spheres in the same layer.
- Tetrahedral holes are formed when a sphere sits in the dimple of three spheres in an adjacent layer.
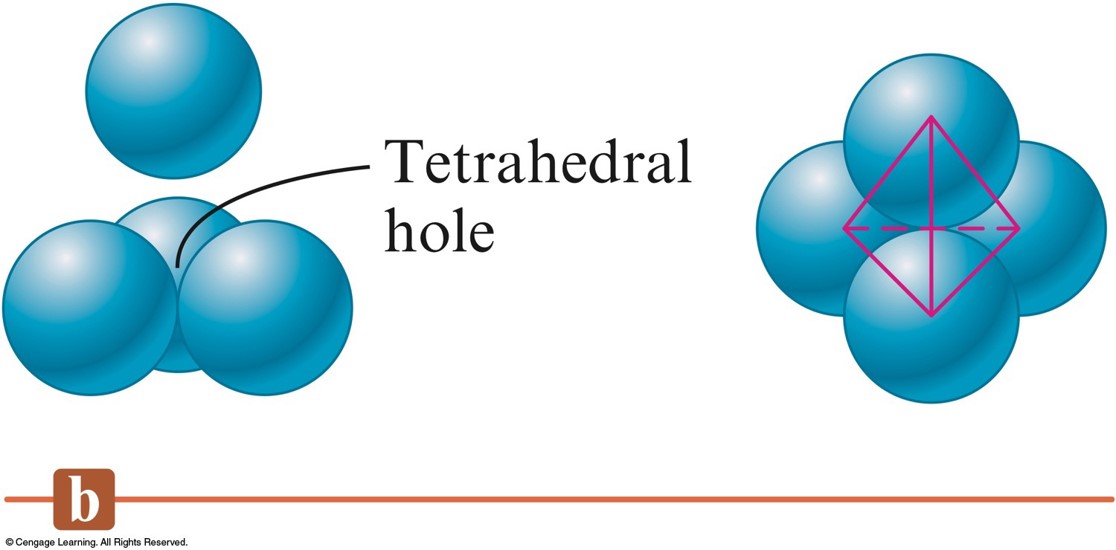
Three Types of Holes in Closest Packed Structures - cont.
- Octahedral holes are formed between two sets of three spheres in adjoining layers of the closest packed structures.
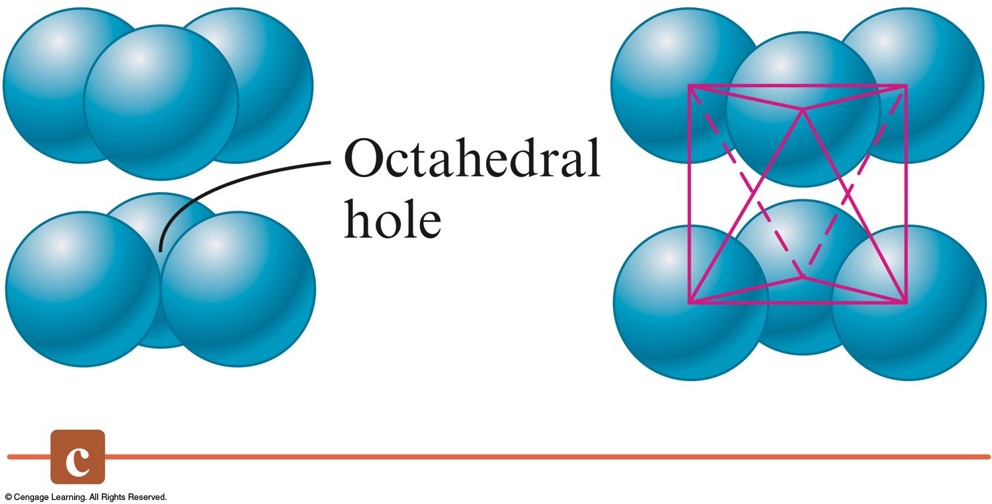
- For spheres of a given diameter, the holes increase in size in the order:
$$ \text{trigonal} \lt \text{tetrahedral} \lt \text{octahedral} $$
Types and Properties of Solids
| Type of Solid |
Atomic |
Molecular |
Ionic |
|
Network |
Metallic |
Group 18 |
|
|
| Structural Unit |
Atom |
Atom |
Atom |
Molecule |
Ion |
| Type of Bonding |
Directional covalent bonds |
Nondirectional covalent bonds involving electrons that are delocalized throughout the crystal |
London dispersion forces |
Polar molecules: dipole-dipole interactions; Nonpolar molecules: London dispersion forces |
Ionic |
| Typical Properties |
Hard |
Wide range of hardness |
|
Soft |
Hard |
|
High melting point |
Wide range of melting points |
Very low melting point |
Low melting point |
High melting point |
|
Insulator |
Conductor |
|
Insulator |
Insulator |
| Examples |
Diamond |
Silver, Iron, Brass |
Argon(s) |
Ice (solid \(\chem{H_2O}\)), Dry ice (solid \(\chem{CO_2}\)) |
Sodium chloride, Calcium fluoride |
Vapor Pressure and Changes of State
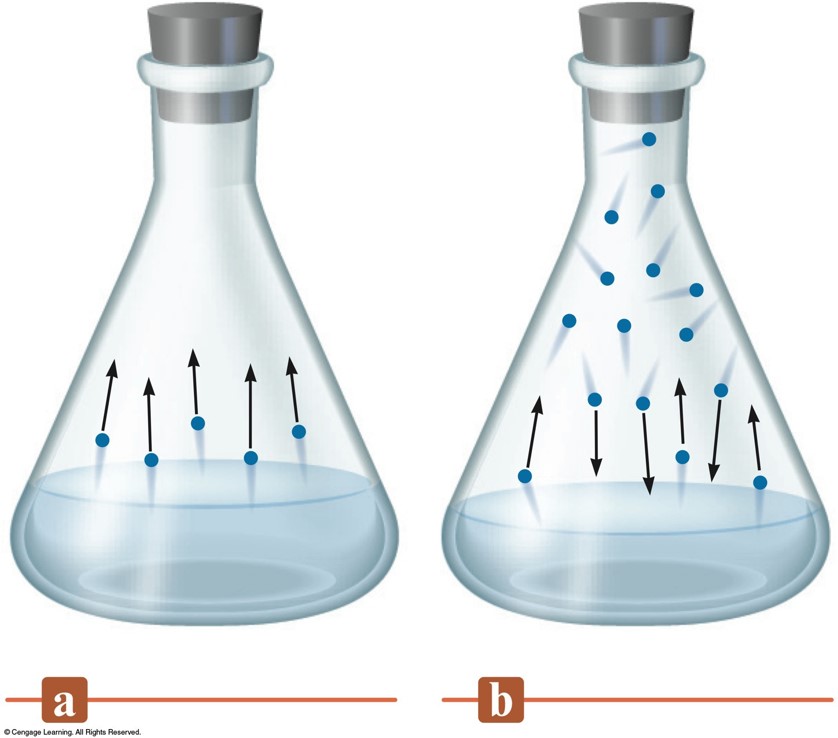
Behavior of a Liquid in a Closed Container
The Rates of Condensation and Evaporation
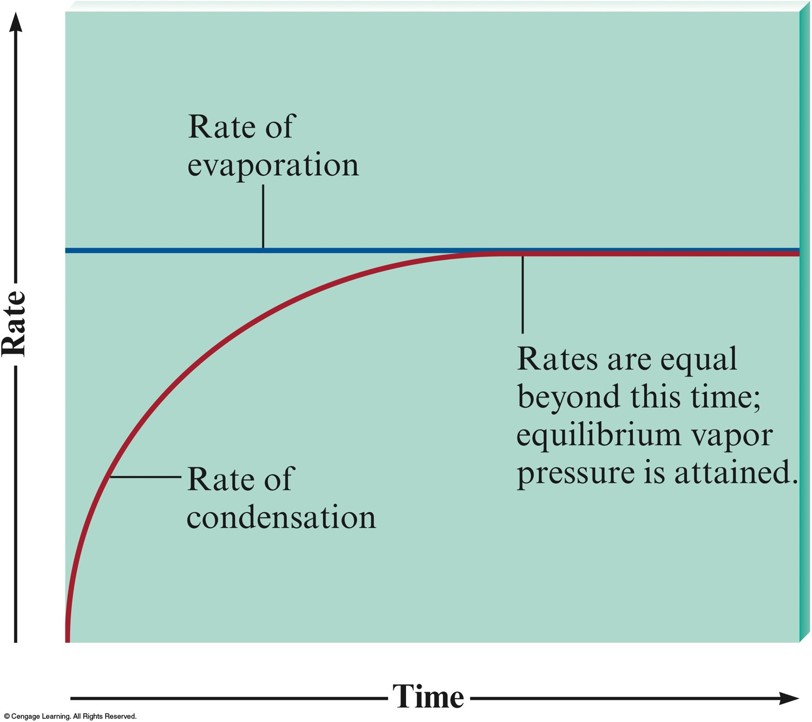
Vapor Pressure
- Pressure of the vapor present at equilibrium.
- The system is at equilibrium when no net change occurs in the amount of liquid or vapor because the two opposite processes exactly balance each other.
Example 1
What is the vapor pressure of water at 100°C?
$$ \phantom{1\,\text{atm}} $$
How do you know?
Example 1 - Answer
What is the vapor pressure of water at 100°C?
$$ \color{green} 1\,\text{atm} $$
How do you know?
The vapor pressure of water at 100°C is 1 atm. You know this because atmospheric pressure is 1 atm and this is the temperature at which we observe water to boil.
Vapor Pressure - cont.
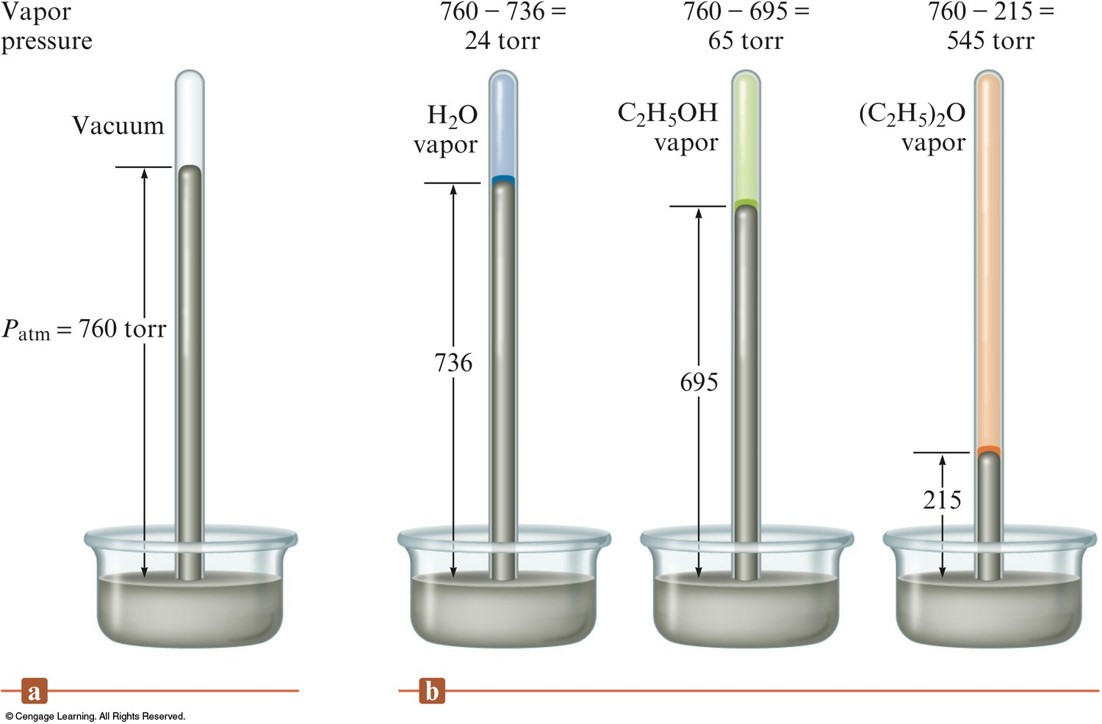
- Liquids in which the intermolecular forces are large have relatively low vapor pressures.
- Vapor pressure increases significantly with temperature.
Vapor Pressure vs. Temperature
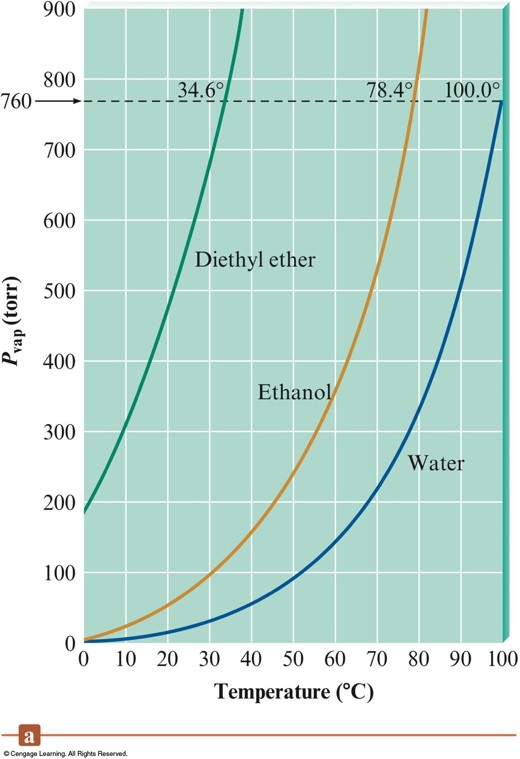
Clausius-Clapeyron Equation
$$ \ln \left( \frac{P_{\text{vap},T_1}}{P_{\text{vap},T_2}} \right) = \frac{\Delta H_\text{vap}}{R} \left( \frac{1}{T_2} - \frac{1}{T_1} \right) $$
- \(P_\text{vap}\) - vapor pressure
- \(\Delta H_\text{vap}\) - enthalpy of vaporization
- \(R\) - \(8.3145\,\bfrac{\text{J}}{\text{K}\cdot\text{mol}}\)
- \(T\) - temperature (in kelvin)
Example 2
The vapor pressure of water at 25°C is 23.8 torr, and the heat of vaporization of water at 25°C is 43.9 kJ/mol. Calculate the vapor pressure of water at 65°C.
Example 2 - Answer
The vapor pressure of water at 25°C is 23.8 torr, and the heat of vaporization of water at 25°C is 43.9 kJ/mol. Calculate the vapor pressure of water at 65°C.
$$ 194\,\text{torr} $$
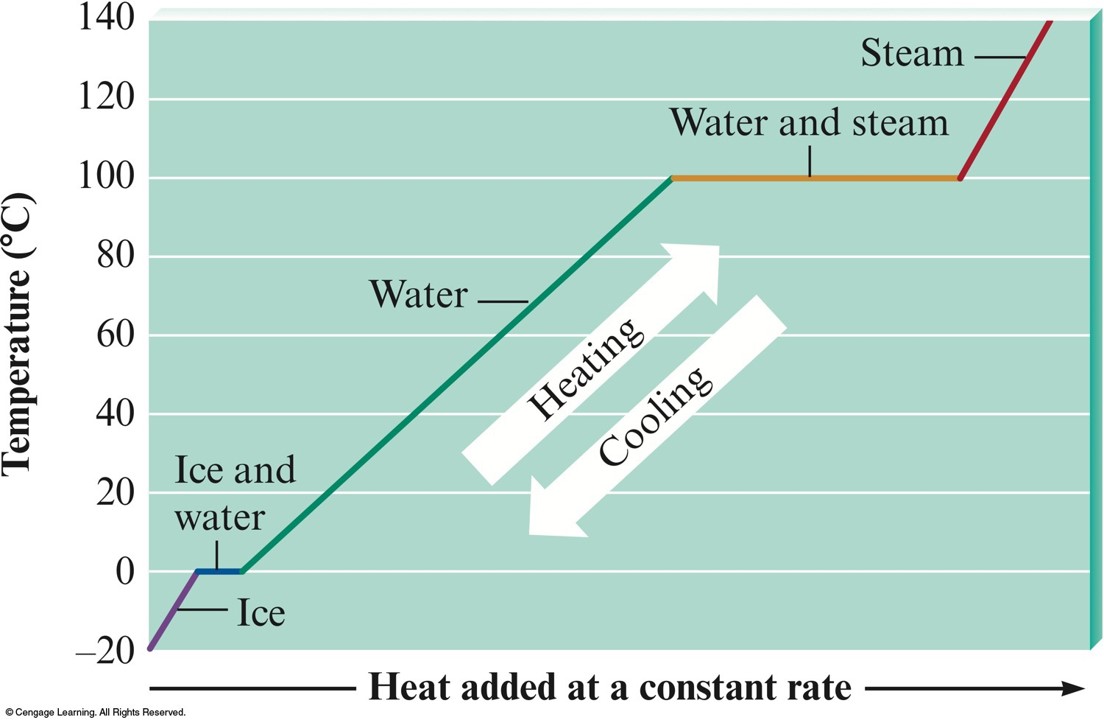
Heating Curve for Water
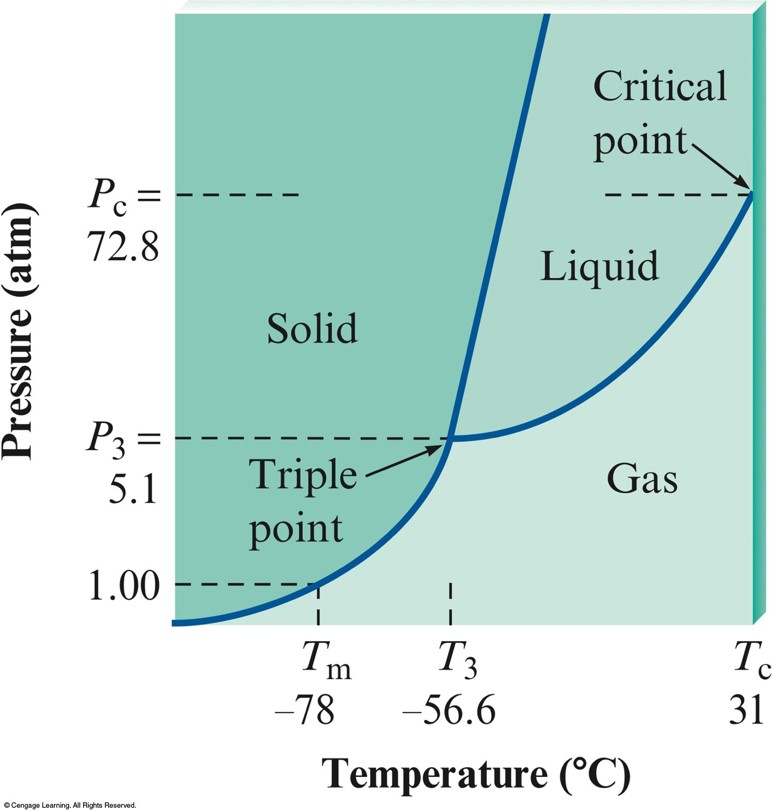
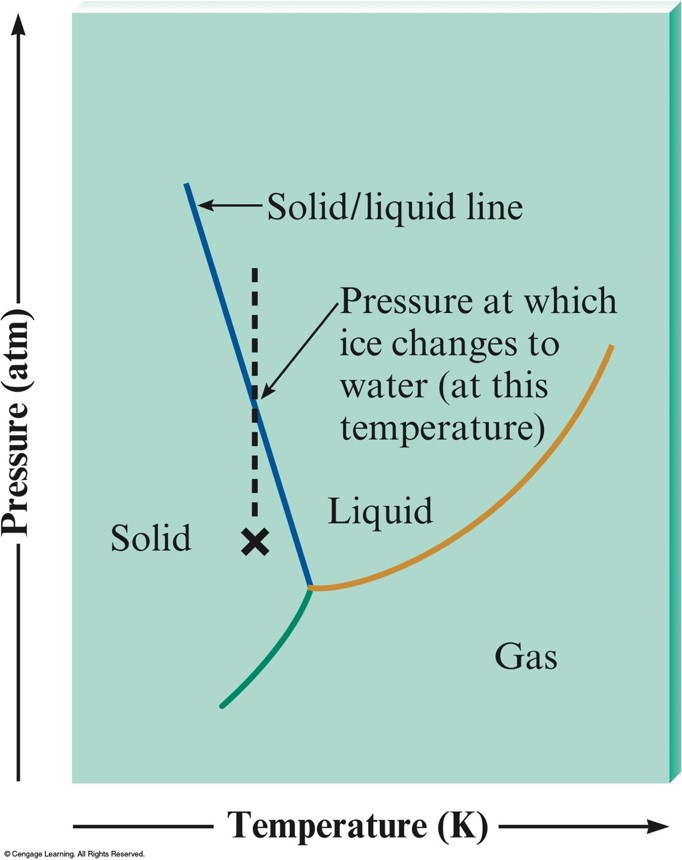
Phase Diagrams
- A convenient way of representing the phases of a substance as a function of temperature and pressure:
- Triple point
- Critical point
- Phase equilibrium lines
Phase Diagram for Carbon Dioxide
Phase Diagram for Water
Concept Check 2
As intermolecular forces increase, what happens to each of the following?
- Boiling point
- Viscosity
- Surface tension
- Enthalpy of fusion
- Freezing point
- Vapor pressure
- Heat of vaporization
Concept Check 2 - Answer
As intermolecular forces increase, what happens to each of the following?
- Boiling point - increases
- Viscosity - increases
- Surface tension - increases
- Enthalpy of fusion - increases
- Freezing point - increases
- Vapor pressure - decreases
- Heat of vaporization - increases
/